Lab 3: Basic Debug Concepts#
This lab will cover the basics of debugging, using the modified gpio_toggle_output.c code from Lab 1. Specific tools and concepts that are covered are:
Breakpoints
Watchpoints
Watch
Debug view
Disassembly view
Other Views
Breakpoints#
Breakpoints are specific points that can be set in the code, where the program is to halt execution. Once halted, the values in registers/memory/etc. can be inspected to gain a deeper understanding of the program execution. This is very useful when debugging.
Note
A hardware breakpoint is required when setting a breakpoint in Flash. The number of available hardware breakpoint resources varies per device. The MSPM0 supports up to four simultaneous hardware breakpoints.
If your MSPM0 LaunchPad is currently running, ensure you are in the Debug view and Pause it. Otherwise, click on Run → Debug Project(…) to flash the program to the target and pause it.
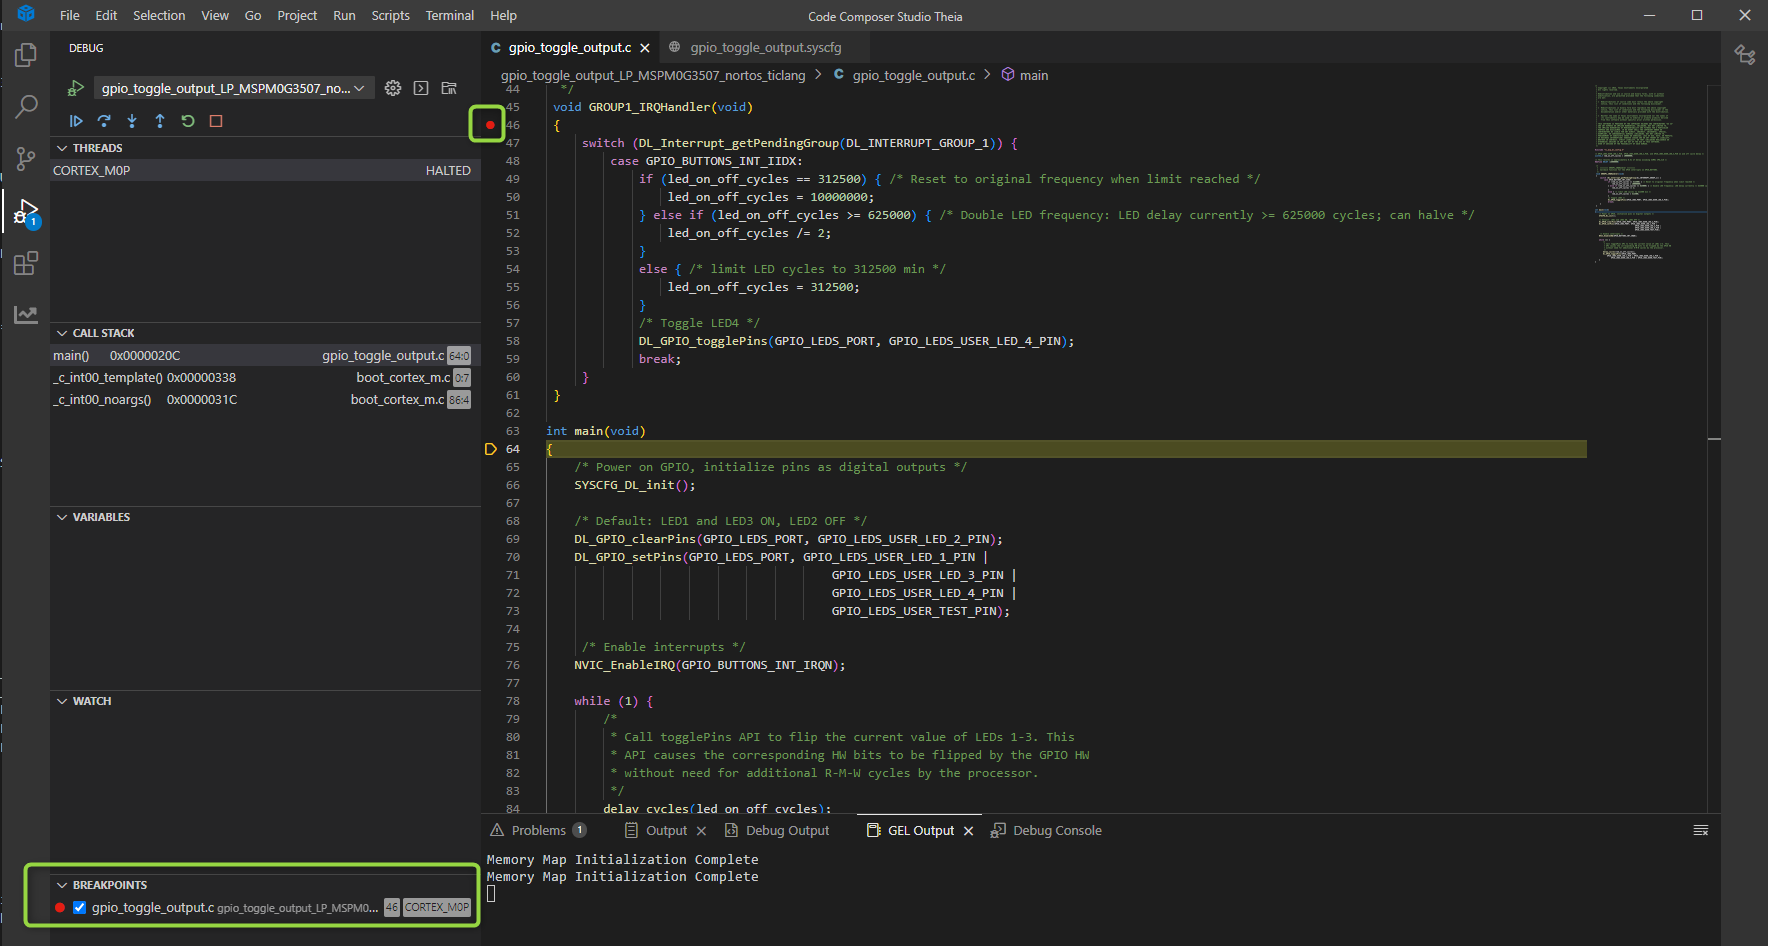
Click on the Breakpoints panel under the Debug view to expand it. There should be no breakpoints to start.
While staying in the Debug view, in gpio_toggle_output.c, scroll to the definition of the GROUP1_IRQHandler() function, and click on the margin to the left of the line number. This will insert a breakpoint that will halt program execution whenever it reaches this point in the code.
Click Run → Continue to resume program execution on the LaunchPad. Click the left button on the board, and note that the program has suspended due to the breakpoint.
By clicking Run → Step Into or Run → Step Over (or using the related buttons in the Debug view), the target will do the associated source step. Click Run → Continue to resume program execution.
Step Into steps to the next line of code, including stepping into a new function call.
Step Over steps to the next line of code in the current function, but will not step into a new function call. It will remain in the current function until it ends or returns.
Step Out steps out of the current function before it reaches its end, and suspends execution on the next statement of the calling function.
After you are finished with this part of the lab, in the Breakpoints panel, remove the breakpoint. You can also remove it by clicking the margin next to the line number in gpio_toggle_output.c, where the breakpoint currently exists.
Watchpoints#
A watchpoint is a type of hardware breakpoint that monitors activity on a memory address, for example where a variable’s value is stored.
If your MSPM0 LaunchPad is currently running, ensure you are in the Debug view and Pause it. Otherwise, click on Run → Debug Project(…) to flash the program to the target and pause it.
Click Run → New Breakpoint → Hardware Watchpoint. This will open a dialog to add a new data breakpoint.
Set the Address to
&led_on_off_cycles(the address ofled_on_off_cycles) and Access type to Write, and click OK. This installs a watchpoint which will pause program execution on the target whenever the value ofled_on_off_cyclesis modified (whenever it is written to).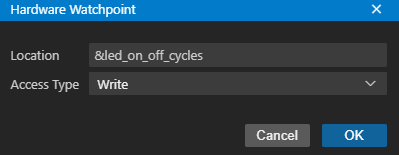
A new breakpoint will be added under the Breakpoints panel under the Debug view.
Click Run → Continue to resume program execution on the LaunchPad. Click the left button on the board, and note that the program has paused due to the data breakpoint.
Leave the data breakpoint set as it will be used in the next section.
Watch#
The Watch view allows you to monitor the values of variables (local, global, static), C-valid expressions and even registers. The value of an expression may also be modified when the situation permits.
Ensure that the program is paused. In the Debug view, click on the Watch panel to expand it. Click on the
+button and addled_on_off_cyclesin Expression to watch. This will display the value ofled_on_off_cycleswhenever the program is paused. Resume the program and click the left button on the board again to pause the program and view the value ofled_on_off_cycleschange.Click Run → Continue to resume program execution on the LaunchPad.
Take note of the speed at which the LED lights are blinking. Click Run → Pause to pause the execution of the program.
In the Watch panel, mouse right-click on the
led_on_off_cyclesexpression and click Edit Expression. Set the value to50000000and click OK. Click Run → Continue to resume program execution. The LED blinking rate should be noticeably slower. This is an example of modifying variable values through the Watch panel.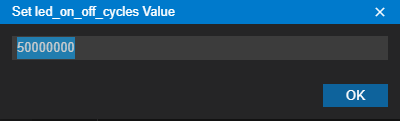
In the Breakpoints panel, remove the data breakpoint. The press the Continuous Refresh button on the toolbar. It is the third button from the left which looks like a continuous circle. This will update the expressions in the view continuously. If the device supports non-intrusive memory accesses (allow the debugger to access memory while the target is running), then the values can be updated while the target is still running. MSPM0 supports non-intrusive memory accesses. Click the left button on the board periodically and note how the
led_on_off_cyclesexpression will change as the button is pressed.After you are finished with this part of the lab, in the Watch panel, remove the led_on_off_cycles expression.
Debug View#
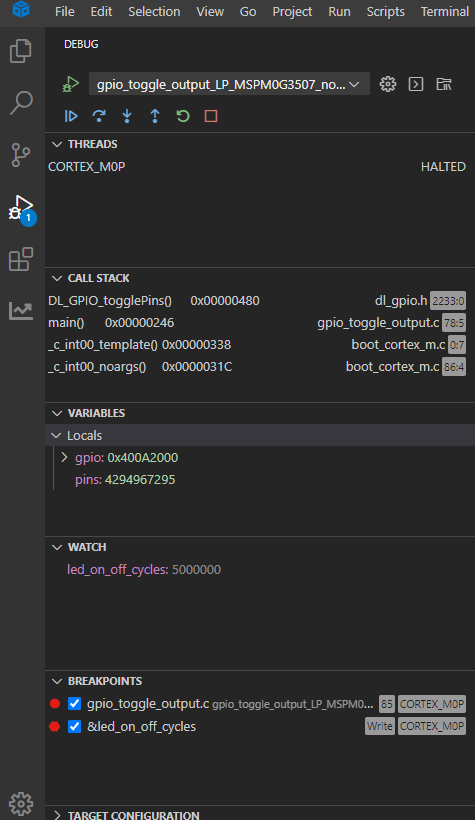
In addition to the target execution toolbar and providing information on Breakpoints, the Debug view also provides more information in the following collapsable views:
Threads: This view will show the current debug session and the status the CPU.
Call Stack: This view will provide the current call stack information for the program.
Variables: This view will display all local variables and related values.
Watch: This view allows you to add/view desired expression. For example, use the
+button to add the global variableled_on_off_cyclesto the list of watch expressions.Breakpoints: This view allows you to view/enable/disable/remove breakpoints.
Disassembly View#
If your MSPM0 LaunchPad is currently running, ensure you can see the Debug view and that execution is Paused. Otherwise, click on Run → Debug Project (…) to flash the program to the target and pause it.
Click on View → Disassembly to open the Disassembly view. By default it will show the disassembly of the current location in the code. The location of the Program Counter is indicated with a small yellow arrow(s). Symbols will be highlighted in green text.
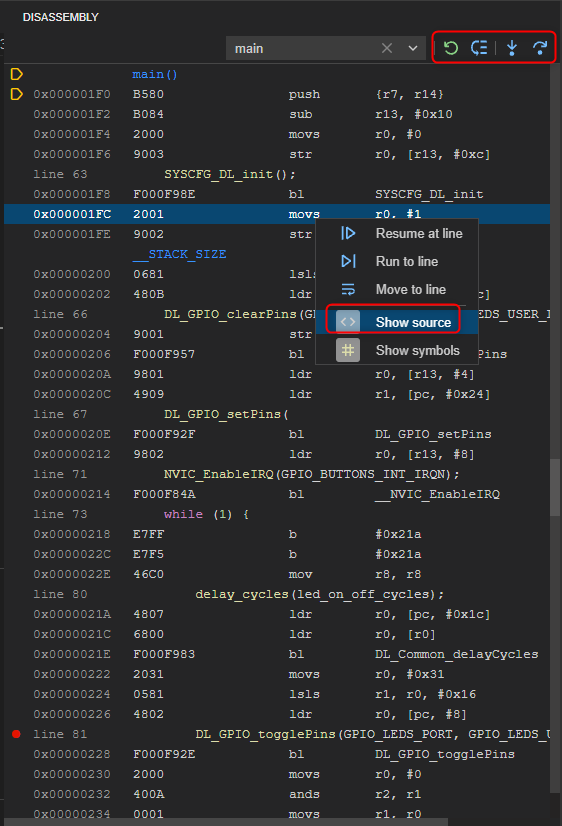
You can enter in an address or symbol in the location box at the top of the Disassembly view to change the address that the view starts at. Enter main to display diassembly content starting from the main symbol.
Note the toolbar with button to Refresh view, Goto current PC location, Assembly step-into, and Assembly step-over.
To toggle source interleaving, bring up the context menu in the Disassembly view and select Show source in the context menu. This will interleave the source lines with the disassembly. Source lines will be highlighted in yellow text
Other Views#
Several other views are available under the View menu. Experiment with the various views such as:
Register View#
The Registers view is used to display and edit the values of core and memory mapped (peripheral) registers. Click on View → Register to open the view.
Memory View#
The Memory view is used to display and edit the values memory. Click on View → Memory to open the view.