Debugging
External Resources
- Debugging common application problems with TI-RTOS video presentation on training.ti.com.
Debug Interfaces
The CC2640R2 platform supports both the cJTAG and JTAG debug interfaces. Debug probes that support cJTAG, like the TI XDS110 and XDS100v3, can work natively with the CC2640R2. Other debug probes that only support JTAG, like the IAR I-Jet and Segger J-Link, need to inject a cJTAG sequence to enable JTAG functionality. The hardware resources included on the devices for debugging are listed as follows. Not all debugging functionality is available in all combinations of debug probe and IDE.
- Flash Patch and Breakpoint Unit (FPB) - 6 instruction comparators, 2 literal comparators
- Data Watchpoint and Trace Unit (DWT) - 5 watchpoints on memory access
- Instrumentation Trace Macrocell (ITM) - 32 x 32 bit stimulus registers
- Trace Port Interface Unit (TPIU) - serialization and time-stamping of DWT and ITM events
XDS110 Debug Probe
The CC2640R2F LaunchPad has an on-board XDS110, and this is the assumed debug probe for most development.
The XDS110 is the latest entry level debug probe (emulators) for TI embedded processors. Designed to be a complete solution that delivers JTAG and SWD connectivity at a low cost, the XDS110 is the debug probe of choice for entry-level debugging of TI microcontrollers, processors and SimpleLink devices. Also, both Core Processor and System Trace are available for all Arm and DSP devices that support Embedded Trace Buffer (ETB).
It is possible to buy the XDS110 as a standalone debugger. See the XDS110 JTAG Debug Probe product page.
Configuring Debugger in Code Composer Studio
If only one debug probe is attached, CCS will automatically select the
connected debug probe when a debug session is started. You can start a debug
session by clicking the debug icon ![]() on the toolbar.
on the toolbar.
If more than one debug probe is attached when a debug session is started, CCS will prompt you to select a debug probe as seen in Figure 122. CCS will save the selected debug probe in the target configuration for the project.
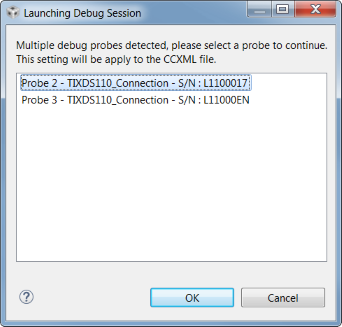
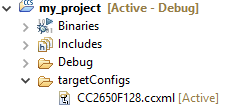
To set or change the selected debug probe for a project, it is necessary to set the serial number for the probe in the project’s target configuration.
Find The Serial Number
To find the serial number for XDS110 debug probe, open a command prompt and run
the xdsdfu.exe command for your CCS version, e.g.
c:\ti\ccs_7_3_0_00019\ccsv7\ccs_base\common\uscif\xds110\xdsdfu.exe -e.
This will enumerate all the attached XDS110 debug probes. This should result in
output like the following.
C:\>c:\ti\ccs_7_3_0_00019\ccsv7\ccs_base\common\uscif\xds110\xdsdfu.exe -e

USB Device Firmware Upgrade Utility
Copyright (c) 2008-2015 Texas Instruments Incorporated.  All rights reserved.

Scanning USB buses for supported XDS110 devices...


<<<< Device 0 >>>>

VID: 0x0451    PID: 0xbef3
Device Name:   XDS110 Embed with CMSIS-DAP
Version:       2.3.0.9
Manufacturer:  Texas Instruments
Serial Num:    L1100017
Mode:          Runtime

<<<< Device 1 >>>>

VID: 0x0451    PID: 0xbef3
Device Name:   XDS110 Embed with CMSIS-DAP
Version:       2.3.0.9
Manufacturer:  Texas Instruments
Serial Num:    L11000EN
Mode:          Runtime

Found 2 devices.

C:\>
For XDS100 series debug probes, open a command prompt and run the
xds100serial.exe command for your CCS version, e.g. c:\ti\ccs_7_3_0_00019
\ccsv7\ccs_base\common\uscif\xds100serial.exe. This should result in output
like the following:
C:\>c:\ti\ccs_7_3_0_00019\ccsv7\ccs_base\common\uscif\xds100serial.exe
Scanning for XDS100 emulators...

VID/PID    Type            Serial #    Description
0403/a6d1  XDS100v3        06EB12213144  Texas Instruments XDS100v3

C:\>
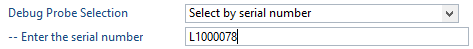
Configure Serial Number
It may be necessary to set or unset the selected debug probe. Use the following steps to do this.
|
|
|
|
|
|
|
|
Connecting to the XDS Debugger
If only one debugger is attached, the IDE uses it automatically when you click
the ![]() button in CCS or
button in CCS or ![]() in IAR.
in IAR.
If multiple debuggers are connected, you must choose the individual debugger to use. The following steps detail how to select a debugger in CCS and IAR.
Configuring Debugger in IAR
If only one debugger is attached, IAR uses it automatically when you click the
![]() button.
button.
If more than one debug probe is connected, use the following steps to have IAR always prompt to select the connection.
- Open the project options (
Project→Options) - Go to the Debugger entry.
- Go to Extra options.
- Add the following command line option:
--drv_communication=USB:#select
Breakpoints
Comparators in the Flash Patch and Breakpoint Unit (FPB) of the CC2640R2F LaunchPad are used to break on an instruction fetch. This can be used to patch a function as it is fetched from instruction memory. Or these comparators can be used to supply a Breakpoint (BKPT) instruction to the CPU. These instructions halt the processors operation, waiting for the debug probe.
Considerations
While breakpoints are a useful tool for debugging code online, they have the possibility of altering the execution flow of a piece of code.
Breakpoints and Timing
Synchronous RF protocols are timing sensitive. Breakpoints can easily halt the execution long enough to lose network timing and break the link.
To still be able to debug, place breakpoints as close as possible to where the relevant debug information can be read or step through the relevant code segment to debug.
After you hit a breakpoint and read out the necessary debug information, it is recommended that you reset the device and re-establish the connection.
Breakpoints and Optimization
When compiler optimizations are enabled, toggling a breakpoint on a line of C code may not result in the expected behavior. Some examples include the following.
- Code is removed or not compiled in
- Toggling a breakpoint in the IDE results in a breakpoint somewhere other than the intended line. Some IDEs disable breakpoints on nonexistent code.
- Code block is part of a common subexpression
- A breakpoint might be trigged from a function or piece of code near the marked line. This might have been due to the compiler reusing sections.
- An if clause is represented by a conditional branch in assembly
- A breakpoint inside an if clause always breaks on the conditional statement, even when the condition is not true.
TI recommends selecting an optimization level as low as possible when debugging. See Optimizations for information on modifying optimization levels.
Breakpoints in CCS
Note
CCS reserves one hardware breakpoint for instruction stepping.
To toggle a breakpoint, do any of the following.
- Double-click the area to the left of the line number.
- Press
Ctrl+Shift+B. - Right-click on the line.
A breakpoint set on line 207 looks like the following.
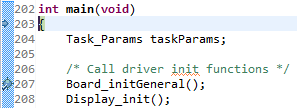
Figure 123. Breakpoint on line 207. Debugger halted at start of main().
For an overview of the active and inactive breakpoints, click on View
→ Breakpoints.
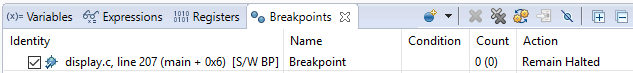
Figure 124. List of breakpoints. Right-click to edit options, or de-select to deactivate.
To set a conditional break, do as follows.
- Right-click the breakpoint in the overview.
- Choose Properties.
When debugging, Skip Count and Condition can help skip a number of breaks or only break if a variable is a certain value.
Note
Conditional breaks require a debugger response and may halt the processor long enough to break an active RF connection, or otherwise disrupt timing on the debug target.
Breakpoints in IAR
Note
IAR reserves one comparator for instruction stepping.
To toggle a breakpoint, do any of the following.
- Single-click the area to the left of the line number.
- Go to the line and press
F9to toggle breakpoint - Right-click on the line and select Toggle Breakpoint (Code).
A breakpoint looks like this:
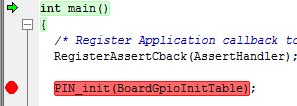
Figure 125. Breakpoint on PIN_init(). Debugger halted at start of main().
For an overview of the active and inactive breakpoints, click
View → Breakpoints.
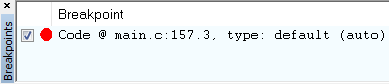
Figure 126. List of breakpoints. Right-click to edit options, or de-select to deactivate.
To set a conditional break, do as follows.
- Right-click the breakpoint in the overview.
- Choose Edit….
When debugging, Skip Count and Condition can help skip a number of breaks or only break if a variable is a certain value.
Note
Conditional breaks require a debugger response and may halt the processor long enough to break an active RF connection, or otherwise disrupt timing on the debug target.
Watching Variables and Registers
Debuggers offer several ways of viewing the state of a halted program. Global variables are statically placed during link-time and can end up anywhere in the RAM or Flash of the chip. These variables can be viewed when then target is halted by the debugger through the Watch and Expression windows.
Unless removed due to optimizations, global variables are always available in these views. Local variables or variables that are only valid inside a limited scope are only viewable in that scope. Such variables can also be viewed with the Watch or Expression views, and may also be automatically displayed when breaking or stepping through code.
Considerations
Local variables are often placed in CPU registers and not on the stack. These variables also have a limited lifetime even within the scope in which they are valid. Depending on the optimization performed, a variable placed in a register may not have a cohesive view of the current state of the variable. Some possible solutions are:
- Move the variable to global scope, so it remains accessible in RAM.
- Make the variable volatile, so the compiler doesn’t place the value in a register.
- Make a shadow copy of the variable that is global and volatile.
Variables in CCS
You can view Global Variables by doing either of the following.
- Select
View→Expressions. - Select a variable name in code.
- Right-click and select Add Watch Expression.
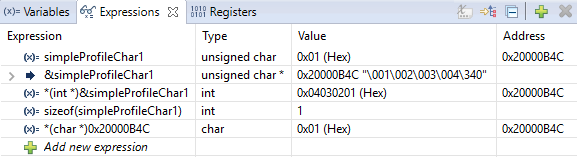
Figure 127. Variable watch window. Note that you can cast values, get address and sizeof, etc.
- Select
View→Variablestoauto-variablesthat are present at the current location when stepping through code.
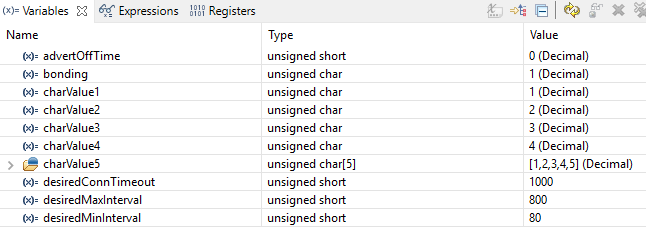
Figure 128. Local variables. This screenshot is taken during execution of the Simple Peripheral init function.
Variables in IAR
To view Global Variables, do either of the following.
- Right-click on the variable.
- Select Add to Watch: varName.
- Select
View→Watch- Enter the name of the variable.
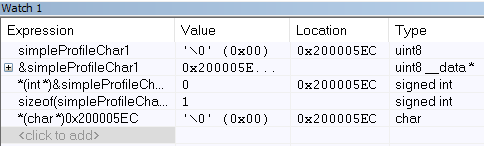
Figure 129. Variable watch window. Note that you can cast values, get address and sizeof, etc.
View –> Locals show the local variables in IAR.
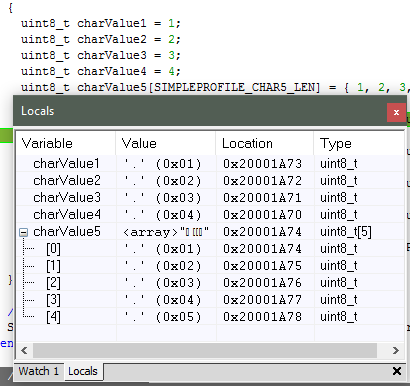
Figure 130. Local variables. This screenshot is taken during execution of the Simple Peripheral init function.
Note
IAR may remove the variable during optimization and inline the usage of the
value. If so, add the __root directive in front.
Memory Watchpoints
As mentioned in Debug Interfaces, the Data Watchpoint and Trace Unit (DWT module) contains four memory watchpoints that allow breakpoints on memory access. The hardware match functionality looks only at the address. If intended for use on a variable, the variable must be statically allocated.
Note
If a data watchpoint with value match is used, two of the four watchpoints are used.
Watchpoints in CCS
- Right-click on a global variable.
- Select
Breakpoint→Hardware Watchpoint. - Go to the list of breakpoints (
View→Breakpoints). - Right-click and edit the Breakpoint Properties to configure the watchpoint.
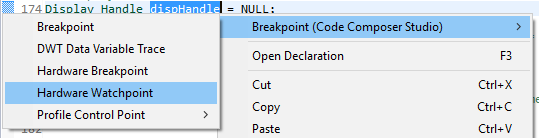
Figure 131. Adding a watchpoint on a variable.
This example configuration ensures that if 0x42 is written to the memory location for Characteristic 1 in the Bluetooth Low Energy simple_peripheral example project the device halts execution.
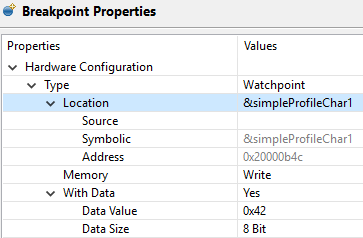
Figure 132. Configuring a hardware watchpoint to break on 8-bit write with value 0x42.
Watchpoints in IAR
- Right-click a variable (global).
- Select
Set Data Breakpoint for 'myVar'to add it to the active breakpoints. - Go to the list of breakpoints (View –> Breakpoints)
- Choose
Edit...to set up whether the watchpoint should match on read, write, or any access.
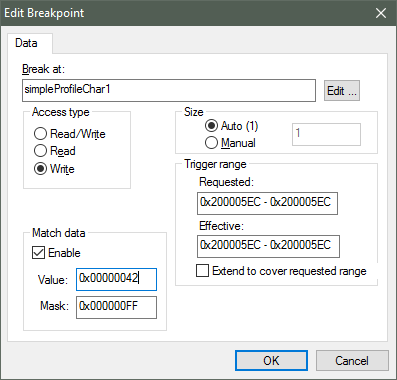
Figure 133. Configuring a hardware watchpoint to break on 8-bit write with value 0x42.
TI-RTOS Object Viewer
Debuggers may include the RTOS Object Viewer (ROV) plug-in that provides insight into the current state of TI-RTOS, including task states, stacks, and so forth.
This section discusses some ROV views useful for debugging and profiling. More details can be found in the TI-RTOS User’s Guide, including documentation on how to add log events to application code.
There exists a known issue when using the auto sized heap configuration (default) with ROV for IAR.
Caught exception in view init code: "C:/ti/xdctools_x_xx_xx_xx_core/packages/xdc/rov/StructureDecoder.xs",
line 518: java.lang.Exception: Target memory read failed at address:
<VALID_ADDR>, length: 32 This read is at an INVALID address according to the
application's section map. The application is likely either uninitialized or
corrupt."
Where <VALID_ADDR> refers to a valid address within the device’s memory, and xdctools_x_xx_xx_xx_core is the specific version of XDCTools that is used.
This error is benign and caused because ROV is unable to find symbols related to the start and end of the heap in the .out file. There are two ways to work around this.
- Use statically sized heap
- Apply the fix in This E2E thread.
Scanning the BIOS for Errors
The BIOS Scan for errors view goes through the available ROV modules and
reports on errors. This functionality can be a good point to start if anything
has gone wrong. This scan only shows errors related to TI-RTOS modules and only
the errors it can catch.
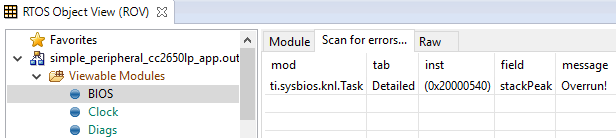
Figure 134. Scan for errors. Here a Task Stack has been overrun.
Viewing the State of Each Task
The Task Detailed view is useful for seeing the state of each task and its
related runtime stack usage. This example shows the state the first time the
user-thread is called. Figure 135. shows the Bluetooth low
energy stack task, represented by its ICall proxy, the Idle task, the
simple_peripheral task and the GAPRole task.
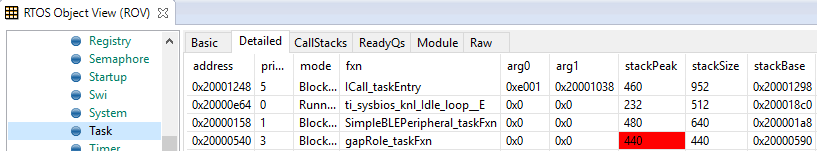
Figure 135. Detailed view of the Tasks. Notice the address of the overrun task matches the instance id from Scan for errors.
The following list explains the column in Figure 135.
- address
- This column shows the memory location of the
Task_Structinstance for each task. - priority
- This column shows the TI-RTOS priority for the task.
- mode
- This column shows the current state of the task.
- fxn
- This column shows the name of the entry function of the task.
- arg0, arg1
- These columns show arbitrary values that can be given to entry function of the task. In the image, the ICall_taskEntry is given 0xb001, which is the flash location of the entry function of the RF stack image and 0x20003a30 (the location of bleUserCfg_t user0Cfg, defined in main()).
- stackPeak
- This column shows the maximum run-time stack memory used based on watermark in RAM, where the stacks are prefilled with 0xBE and there is a sentinel word at the end of the run-time stack.
Note
Function calls may push the stack pointer out of the run-time stack, but not actually write to the entire area. A stack peak near stackSize but not exceeding it may indicate stack overflow.
- stackSize
- This column shows the size of the runtime stack, configured when instantiating a task.
- stackBase
- This column shows the logical top of the runtime stack of the task (usage starts at stackBase + stackSize and grows down to this address).
Viewing the System Stack
The Hwi Module view allows profiling of the system stack used during boot
or for main(), Hwi execution, and Swi execution. See
sec-memory-management-system-stack for more information on the system
stack.
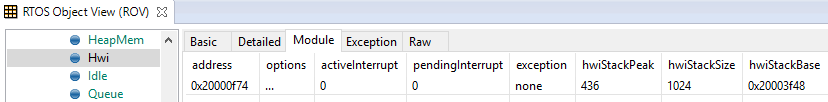
Figure 136. Viewing the System Stack in Hwi
The hwiStackPeak, hwiStackSize, and hwiStackBase can be used to check for system stack overflow.
ROV in CCS
To access the ROV while in a debug session in CCS:
- Click the Tools menu.
- Click RTOS Object View (ROV).
ROV in IAR
To access the ROV while in a debug session in IAR
- Use the TI-RTOS menu on the menu bar.
- Select a subview.
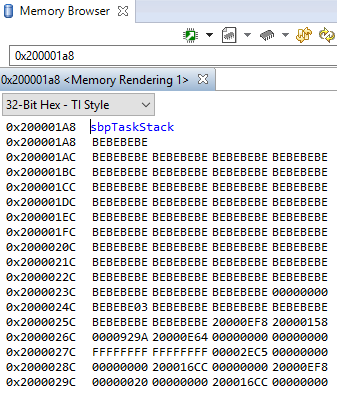
Using the Memory Browser
Debuggers are able to show a representation of the memory on the CC2640R2. In CCS, you can index by address or by symbol name. As an example, consider the stack that was overrun in Figure 135.:
Simple Peripheral Task’s stack. Note BE watermark |
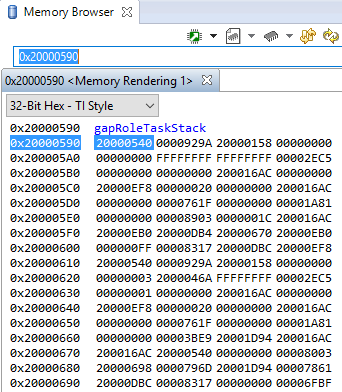
GAPRole Task’s stack. Note it’s completely filled. |
|
|
The solution in this case would be to increase the stack size for the failing
task and see what the stack peak really is. The stackPeak reported is
relying on how many watermark bytes are overwritten, so it can’t know how much
the overrun amounts to.
Because stacks are utilized from higher addresses towards lower addressed (upwards in the picture), stacks that overrun will tend to overwrite data at locations immediately before the stack.
Connect the debugger to a running target
Connecting the debugger to a target can help when you want to see the status of your target after it has been running for several hours, or even days; or if you cannot reproduce a crash with the debugger attached. Once the debugger connected to the target, all the usual functionalities (break points, step-by-step, variable view, ROV, memory view…) are available.
This step-by-step guide will help you to configure CCS in order to connect to a running target
Modify the GEL file
In a very simplistic view, the GEL files describe the way the device’s debugger has to act (more details can be found in the CCS’s help). By default, the GEL files ask the device to reset when the debugger is started up. Fortunately we can modify this:
Identify the GEL file to modify
- Start a debug session as always
- (If needed), display the debug view
- Right-click on the program being, “Open GEL files View”.
- In the GEL files list, open the corresponding GEL file by double-clicking it. Chose cc26x2.gel for CC26x2 and CC13x2 devices. Chose cc26x0.gel for CC26x0 and CC13x0 devices.
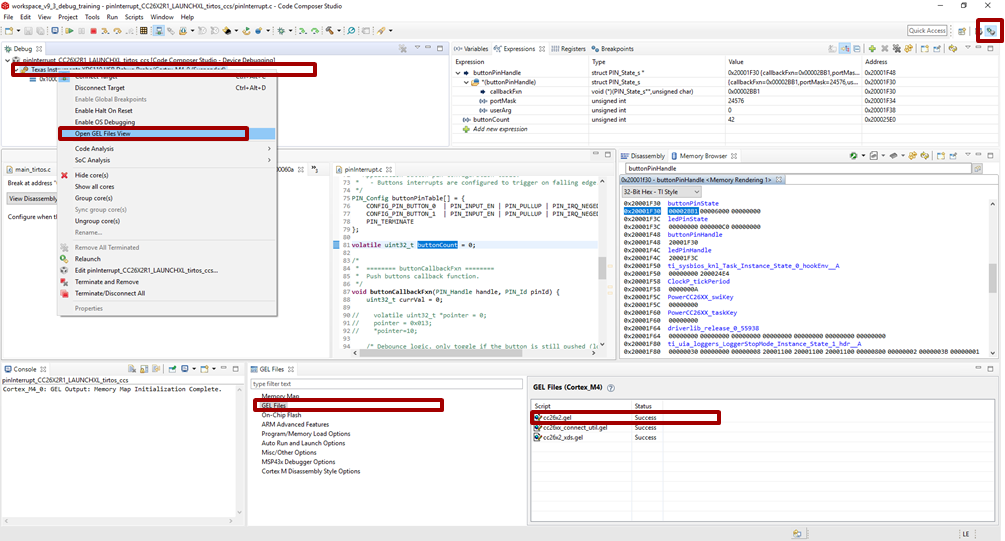
Figure 137. Locate the GEL file to modify.
Figure 137. shows how to find the GEL file to modify.
Note
Another possibility consists in looking directly in
<CCS directory>\ccs_base\emulation\gelfor the GEL file.Caution
The modifications done in a GEL file affect all the devices using the same GEL files. In other words, it affects all the CC26X2 and CC13X2 if you modified cc26x2.gel, and all the CC26x0 and CC13x0 if you modified cc26x0.gel. By default, two different CCS versions do not use the same GEL files.
In the
StartUp()function, comment out the code executing the reset. If needed, an explicit comment will help you to identify the code to comment out.1 2 3 4 5 6 7 8 9 10 11 12 13 14 15 16 17 18 19 20 21 22 23 24 25 26 27 28 29 30 31
StartUp(int major, int minor, int patch)
{
    /* Initialize memory map */
    memorymap_init();

    /* Debugger specific handling */
    if(GEL_MatchesConnection(".*TIXDS.*") == 1)
    {
        GEL_LoadGel("$(GEL_file_dir)/cc26xx_connect_util.gel");
        GEL_LoadGel("$(GEL_file_dir)/cc26x2_xds.gel");

        DefineResets(0);

        // Issue Board Reset to ensure device is in a known state
        // Note: If you want to attach to a running target without resetting the
        //       device, you must comment out the following 4 lines:
    //  if(!GEL_IsConnected())
    //  {
    //      GEL_AdvancedReset("Board Reset");
    //  }
    }
    else if(GEL_MatchesConnection(".*JLink.*") == 1)
    {
        GEL_LoadGel("$(GEL_file_dir)/cc26xx_jlink.gel");
    }
    else
    {
        GEL_TextOut("Error: Unknown debugger.\n");
        return;
    }
}
Save your modification and close the file. Stop your debugging session
Caution
The modification of the debug configurations only affects one project.
Modify the Debug Configuration of your project
Once you have clicked CCS’s debug button (the green bug), CCS is doing a lot of actions for you. For example, CCS loads the program and stops the execution of the code on the target. In our case, we don’t want CCS to load the program (as we already have a running program…). In addition, we don’t necessarily want to stop the execution of the code on the target. Fortunately, the way CCS is running a debug session is highly configurable. So let’s adapt those configurations to our needs.
On the right of the Debug button, there is an arrow. Click this arrow and select Debug Configurations….
Select your project
Prevent CCS from loading the program: in the Program tab, chose the proper Loading options (Load symbols only)
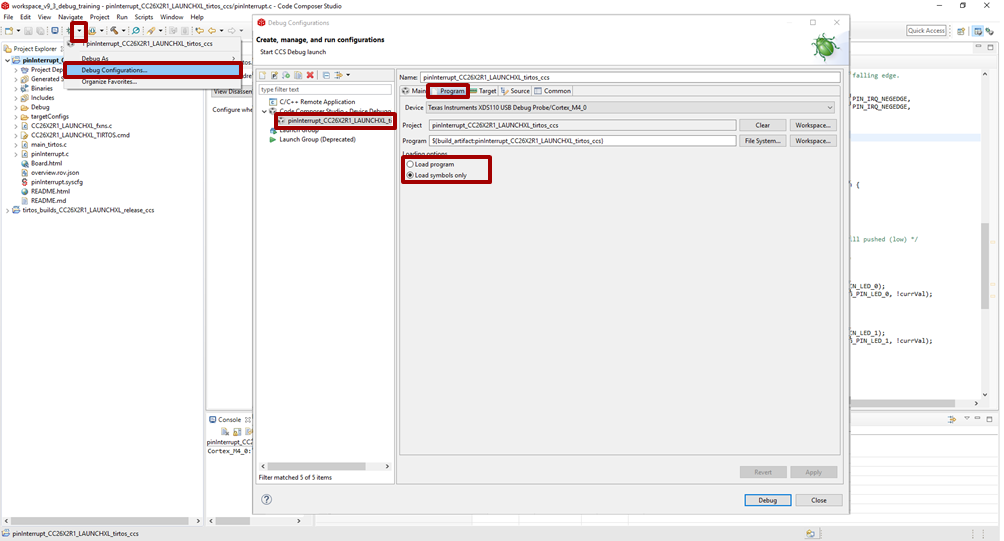
Figure 138. Open the Debug configurations and modify the loading options.
Prevent CCS from stopping the target: in the Target tab, deselect the option Halt the target on a connect
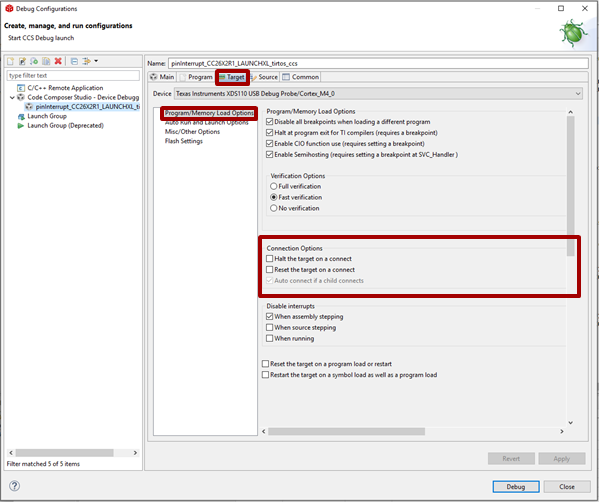
Figure 139. In the Debug configurations, modify the Connection options.
[Optional] Prevent CCS from building the program before load
As no program will be loaded, it is a bit useless to ask CCS to build an image when you start a debug session. As result, you can disable this option by using the small arrow at the right of the Flash button. Click on Build Project Before Load in order to disable the option.
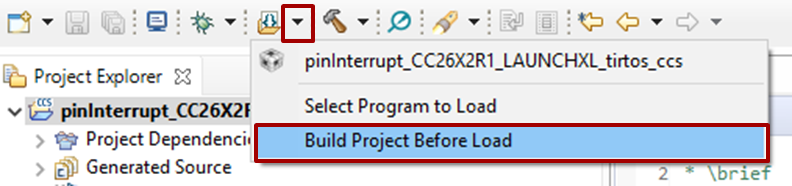
Figure 140. Disable “Build Project Before Load” option.
Now, the debug button does not anymore load code on the device. So, how can you load a new image on the device? The easiest way is to use the Flash button and select the image to flash. Don’t forget to rebuild your image manually (as we have disabled the option before). Another solution consists in undoing all the configuration changes we did before. A third solution consists in using a different version of CCS.
Tip
You are all set now! Let the code running and, when needed, connect to the running target by using the Debug button as you usually do.
Optimizations
Compiler optimizations are great for saving space or speeding up execution. However, these optimizations can be very difficult to debug around. There are multiple levels at which optimization can be turned on or off.
Project-wide optimization settings are the most general. Sometimes, given the constraints of the device, it is impossible to lower the size optimization level. File-wide optimization settings can be used like project-wide optimizations to turn on or off certain settings. The most granular control is using compiler directives to control optimization at a function level.
Optimizations in CCS
Project-Wide Optimizations
Open the project optimization settings by going to Project Properties
→ CCS Build → ARM Compiler → Optimization
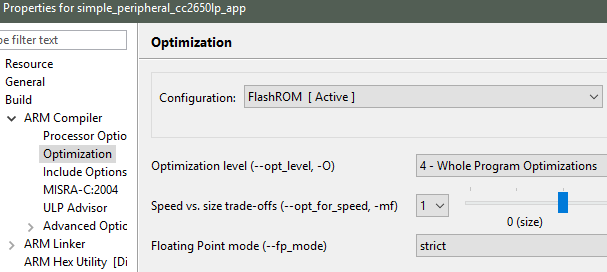
Figure 141. Project-level optimization setting in CCS
Single-File Optimizations
Note
Do single-file optimizations with care because this also overrides the project-wide preprocessor symbols.
- Right-click on the file in the Workspace pane.
- Choose Properties.
- Change the optimization level of the file using the same menu in the CCS project-wide optimization menu.
Single-Function Optimizations
Warning
Care must be taken when using pragmas, since they are very specific to the toolchain and may render non-reusable code.
Important
- The TI ARM Clang compiler does not support single-function optimizations. Use Single File optimizations instead.
- For additional details, check section 3 of the TI ARM Clang User’s Guide.
#pragma FUNCTION_OPTIONS(myFunction, "--opt_level=0")
static void myFunction(int number)
{
    // ...
    return yourFunction(other_number);
}
#pragma GCC push_options
#pragma GCC optimize ("O0")
static void myFunction(int number)
{
    // ...
    return yourFunction(other_number);
}
#pragma GCC pop_options
Optimizations in IAR
Project-Wide Optimizations
Project Options → C/C++ Compiler → Optimizations
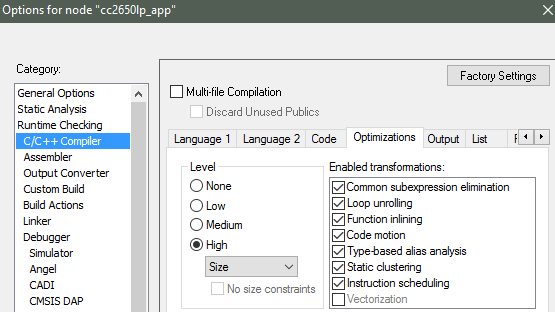
Figure 142. Project-level optimization setting in IAR
Single-File Optimizations
- Right-click on the file in the Workspace pane.
- Choose Options.
- Check Override inherited Settings.
- Choose the optimization level.
Single-Function Optimizations
Warning
Pragmas are very specific to the toolchain, and may lead to non-reusable code. Be careful where you use these.
Use #pragma optimize=none before the function definition to deoptimize the entire function, that is, as follows.
#pragma optimize=none
static void myFunction(int number)
{
    // ...
    return yourFunction(other_number);
}
Loading TI-RTOS in ROM Symbols
Some of the TI-RTOS kernel modules are included in ROM, and executed from ROM in order to save Flash space for the application. This can lead to some confusion, when only addresses are shown in the disassembly view and the call-stack view.
In order to make sense of the code that executes out of ROM, you need to include the symbols file in your debug session, as explained next.
Import in CCS
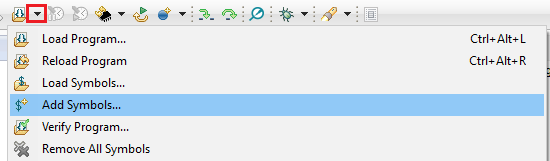
Figure 143. Adding symbol information for the BIOS kernel in ROM, via Add Symbols.
- While in debug mode, click the drop-down button next to the Load Program icon
- Select
Add Symbols ... - Select
Browse ...and find the symbols file:
<SDK_INSTALL_DIR>\kernel\tirtos\packages\ti\sysbios\rom\cortexm\cc26xx\r2\golden\CC26xx\rtos_rom.xem3
Import in IAR
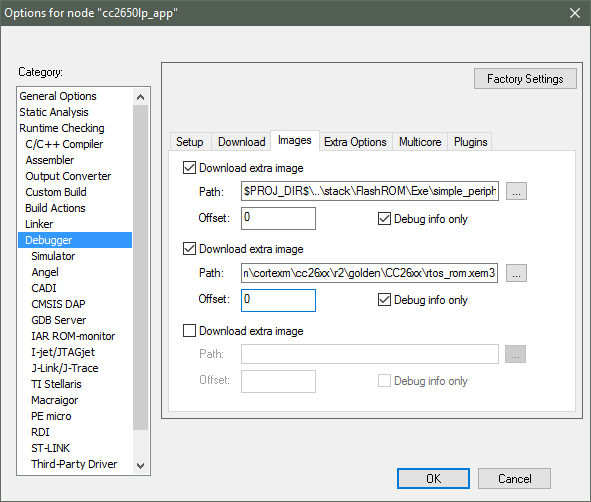
Figure 144. Adding symbol information for the BIOS kernel in ROM
- In the project options, go to
DebuggerandImages - Set Offset = 0 and check the box for ‘Debug info only’
- Then find the image file:
<SDK_INSTALL_DIR>\kernel\tirtos\packages\ti\sysbios\rom\cortexm\cc26xx\r2\golden\CC26xx\rtos_rom.xem3
Deciphering CPU Exceptions
Several possible exception causes exist. If an exception is caught, an exception handler function can be called. Depending on the project settings, this handler may be a default handler in ROM, which is just an infinite loop or a custom function called from this default handler instead of a loop.
When an exception occurs, the exception may be caught and halted in debug mode immediately, depending on the debugger. If the execution halted manually later through the Break debugger, it is then stopped within the exception handler loop.
Exception Cause
With the default setup using TI-RTOS, the exception cause can be found in the
System Control Space register group (CPU_SCS) in the register CFSR
(Configurable Fault Status Register). The Arm Cortex User Guide describes
this register. Most exception causes fall into the following three categories.
- Stack overflow or corruption leads to arbitrary code execution.
- Almost any exception is possible.
- A NULL pointer has been dereferenced and written to.
- Typically (IM)PRECISERR exceptions
- A peripheral module (like UART, Timer, and so forth) is accessed
without being powered.
- Typically (IM)PRECISERR exceptions
The CFSR register is available in View → Registers.
When an access violation occurs, the exception type is IMPRECISERR because writes to flash and peripheral memory regions are mostly buffered writes.
If the CFSR:BFARVALID flag is set when the exception occurs (typical for
PRECISERR), the BFAR register in CPU_SCS can be read out to find which
memory address caused the exception.
If the exception is IMPRECISERR, PRECISERR can be forced by manually disabling
buffered writes. Set CPU_SCS:ACTRL:DISDEFWBUF to 1, by either manually
setting the bit in the register view in the debugger or by including
<hw_cpu_scs.h> from Driverlib and calling the following.
#include <ti/devices/cc26x0r2/inc/hw_cpu_scs.h>
//..
int main()
{
    // Disable write-buffering. Note that this negatively affect performance.
    HWREG(CPU_SCS_BASE + CPU_SCS_O_ACTLR) = CPU_SCS_ACTLR_DISDEFWBUF;
    // ..
}
Using TI-RTOS and ROV to Parse Exceptions
To enable exception decoding in the RTOS Object View (ROV) without using too much memory, use the Minimal exception handler in TI-RTOS. The default choice in the BLE-Stack projects is to use no exception handler.
To set this up, change the section of the TI-RTOS configuration file that relates to M3Hwi so that it looks like the code below:
//m3Hwi.enableException = true;
m3Hwi.enableException = false;
//m3Hwi.excHandlerFunc = null;
m3Hwi.excHookFunc = "&execHandlerHook";
Then, make a function somewhere with the signature void
(*Hwi_ExceptionHookFuncPtr)(Hwi_ExcContext*); such as the one below:
#include <ti/sysbios/family/arm/m3/Hwi.h>
// ...
volatile uintptr_t *excPC = 0;
volatile uintptr_t *excCaller = 0;
// ...
void execHandlerHook(Hwi_ExcContext *ctx)
{
    excPC = ctx->pc;     // Program counter where exception occurred
    excCaller = ctx->lr; // Link Register when exception occurred

    while(2);
}
Setting m3Hwi.enableException to false enables the minimal handler, which
fills out the global Hwi_ExcContext structure that the ROV looks at to show
the decoded exception. By setting up an excHookFunc, the minimal exception
handler will call this function and pass along a pointer to the exception
context for the user to work with. This structure is defined in
<ti/sysbios/family/arm/m3/Hwi.h>.
When an exception occurs, the device should end up in that infinite loop.
Inspect the ROV → Hwi → Exception information.
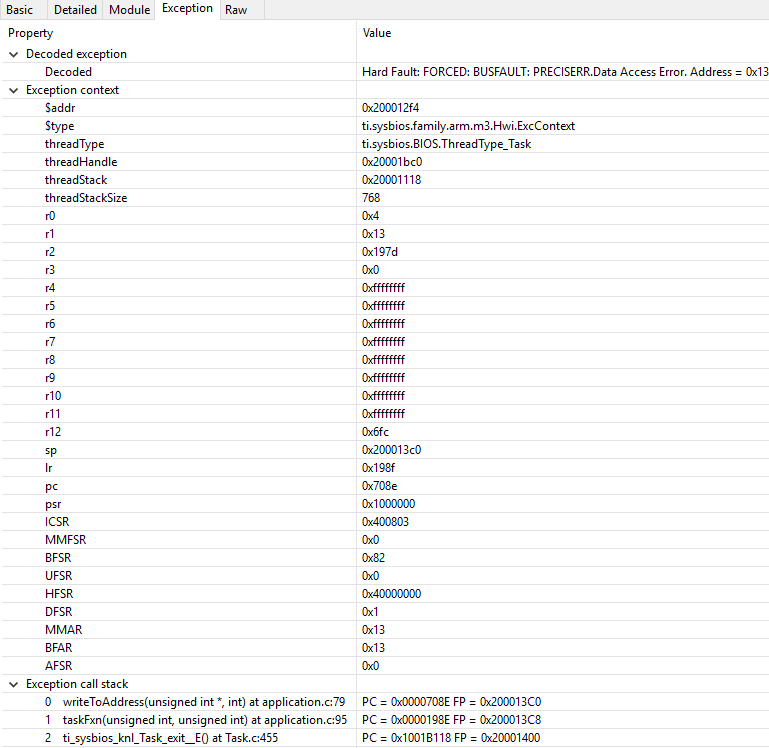
Figure 145. Decoded exception, intentional write to address 0x0013 which is illegal. Note that writebuffering has been disabled to get a precise error location, and that m3Hwi.enableException has been set to false to get the decoding.
In this case, a bus fault was forced in the function writeToAddress by dereferencing address 0x0013 and trying to write to it:
void writeToAddress(uintptr_t *addr, int val)
{
    *(int *)addr = val;
}

// ..

void taskFxn(...)
{
    // ..
    writeToAddress( (void*)19, 4 ); // Randomly chosen values
}
The write instruction was placed on line 79 of application.c, as indicated. To
get a precise location, the write buffer was disabled as described earlier.
It can be instructive to look at the disassembly view for the locations specified by PC (program counter) and LR (link register). PC is the presumed exception location, and LR is normally the location the failing function should have returned to. As an example, the PC at this exception:
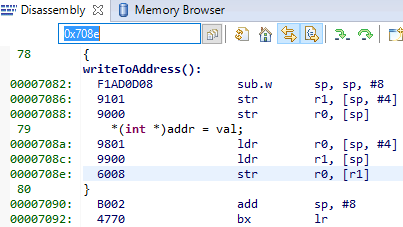
Figure 146. Here the pc from the decoded exception was looked up in the disassembly
view.
Some forensics is required here. We have from the Hwi decoding in ROV (and from
the exception context in the exception hook) that the program counter was
0x708e when the exception occurred.
At that location there is a store instruction str r0, [r1] meaning, store
in R0 the value of what the memory address in R1 points to. The business with
SP in the figure above is related to optimization being turned off, so all
local variables are stored on the stack, even though in this case R0 and R1
could have been used directly from the caller.
Now we know that the exception occurred because someone called
writeToAddress with an invalid address.
Thanks to the exception decoder we can easily find the call site by looking at
the call stack, but if the call stack isn’t helpful, we can look at lr,
which is seen in the exception decoder to be 0x198f
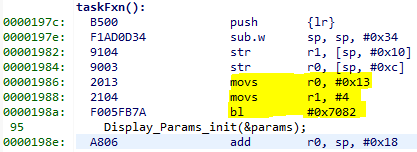
Figure 147. Call site as specified in lr. Note that lr is the instruction after the
call to writeToAddress because execution would have resumed here.
We can see here that R0 and R1 are initialized with constants. This means that some programmer has intentionally called the write function with an address that causes a busfault.
Most often the reason for a bus-fault is that a pointer is not initialized and
a function like writeToAddress gets the pointer, assumes it’s valid and
dereferences the pointer and writes to the invalid address.
Application exits prematurely
When an application is built with TI-RTOS kernel instrumentation enabled, it is
possible that one of its runtime checks might cause the application to terminate
prematurely. Typically when this occurs, the application will halt at a
breakpoint symbol called loader_exit (in CCS) or __exit (in IAR).
Various available runtime checks are enabled via the TI-RTOS .cfg
configuration file. To determine what checks are enabled, you can see the
documentation included in the .cfg file or refer to the TI-RTOS kernal
User Guide directly.
Some applications may contain a pair of Debug and Release build configurations. When such build configurations exist, the Debug configuration takes advantage of utilizing a suite of runtime checks. These runtime check can include but are not limited to:
- Task stack overrun checks
- System stack overrun checks
- Various asserts (Tasks, Swi, Hwi, etc…)
- Loggers (UIA loggers)
- Kernel policy checks (Checking if runtime creation/deletions are permitted)
When an runtime check detects an anomaly, the kernel responds by capturing and
printing the fault condition and halting the system at the exit
or loader_exit symbol.
loader_exit in CCS
If a fault condition causes an application to exit prematurely in CCS, the
target will halt at the loader_exit symbol - as shown
in Figure 148.. The cause for the fault condition is typically
displayed in the console window.
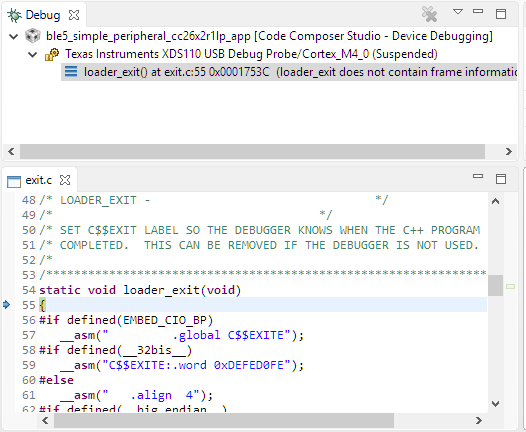
Figure 148. A sample view when a CCS application terminates.
If the console window is not already open, CCS will open the console window for you and print the cause for the termination. Alternatively, you can also use ROV to determine the cause for the fault.
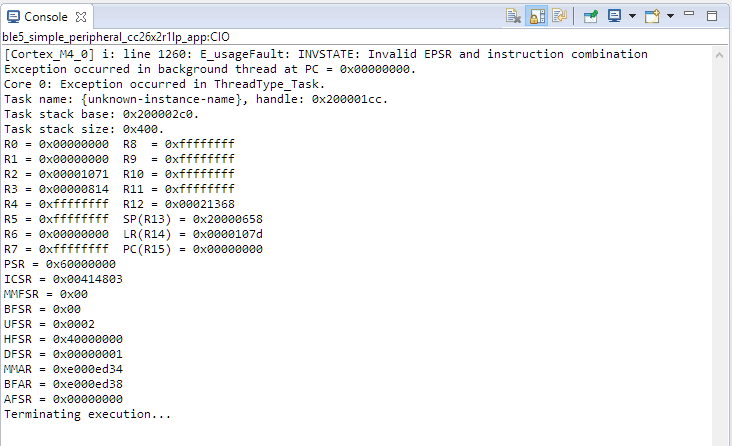
Figure 149. Sample output of an exception onto the CCS console.
__exit in IAR
When an application exits prematurely in IAR, the fault condition is displayed
in the Terminal I/O window. With IAR, the Terminal I/O window does not open
automatically. To the developer, the application will simply halt at __exit
as shown in Figure 150..
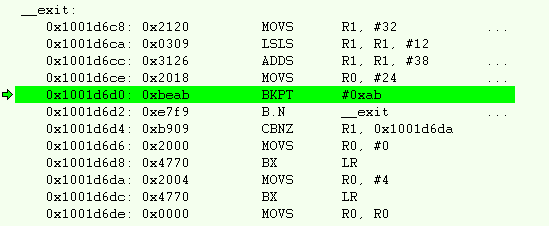
Figure 150. Disassembly view when an IAR application terminates.
In such an event, you will need to manually open the Terminal I/O window under View → Terminal I/O so you can see the cause for the fault. Alternatively, you can also use ROV to determine the cause for the fault.
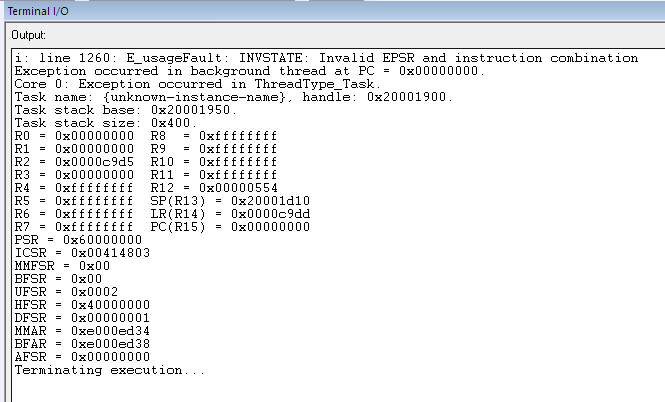
Figure 151. Sample output of the Terminal I/O window when an exception occured.
XDC Runtime Errors
The TI-RTOS kernel uses the XDC runtime Error module to check for runtime errors
or configurations that are not allowed in the kernel. When this occurs, an XDC
runtime error will be raised. The Error module is discussed in depth in the
Bios_User_Guide which can be found in the docs/tirtos/sysbios/docs
folder of the SDK.
That guide should be referenced for more information. This section only seeks to discuss the specifics of the SimpleLink CC26xx/CC13xx devices in the XDC Runtime Error context.
The CC26xx/CC13xx uses a minimal TI-RTOS kernel image that is partially in ROM. This implementation will use a spinlock for its error implementations, and does not load the TI-RTOS text module. This offers minimal error decoding.
See a sample XDC runtime error in the screen shot below:
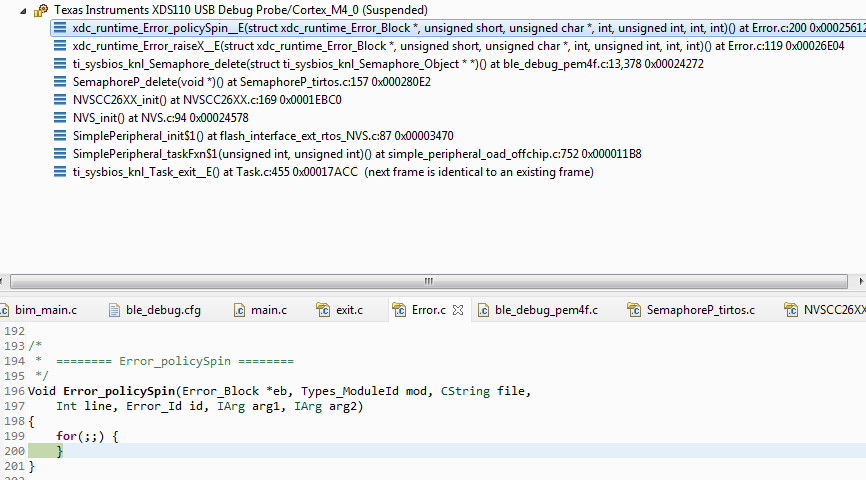
In order to properly decode errors the following settings are recommended in the TI-RTOS .cfg file.
- Use the kernel in flash (i.e. no references to
ROM = xdc.useModule('ti.sysbios.rom.ROM');)- Use
Error.policyFxn = Error.policyDefault;- Use
Error.raiseHook = Error.print;- Set
Text.isLoaded = true;
Warning
The above settings are flash intensive and may not fit on the device. It is recommended to use these only for debugging and remove them for release configurations.
Debugging Memory Problems
This section describes how to debug a situation where the program runs out of memory, either on the heap or on the runtime stack for the individual thread contexts. Exceeding array bounds or dynamically allocating too little memory for a structure corrupts the memory and can cause an exception like INVPC, INVSTATE, IBUSERR to appear in the CFSR register.
Task and System Stack Overflow
If an overflow on the runtime stack of the task or the system stack occurs (as found using the ROV plug-in), perform the following steps.
- Note the current size of the runtime stack of each task.
- Increase by a few 100 bytes as described in Initializing a Task and sec-memory-management-system-stack
- Reduce the runtime stack sizes so that they are larger than their respective stackPeaks to save some memory.
Dynamic Allocation Errors
Debugging Common Heap Issues describes how to use the ICall Heap profiling functionality. To check if dynamic allocation errors occurred, do as follows:
- Check whether
heapmgrMemAloorheapmgrMemAloare close toHEAPMGR_SIZE - Check memFail to see if allocation failures have occurred.
- Call the sanity check function.
If the heap is sane but there are allocation errors, increase
HEAPMGR_SIZE and see if the problem persists.
You can set a breakpoint in heapmgr.h in HEAPMGR_MALLOC() on the
line hdr = NULL; to find an allocation that is failing.
Check System Flash and RAM Usage With Map File
Both application and stack projects produce a map file which can be used to compute the combined flash and RAM system memory usage. Both projects have their own memory space and both map files must be analyzed to determine the total system memory usage. The map file is in the output folder of the respective project in IAR. To compute the total memory usage, do as follows.
- Open the application map file (that is, simple_peripheral_cc2650r2lp_app.map).
Note
At the end of the file, three lines contain a breakdown of memory usage for read-only code, read-only data, and read/write data.
- Add the two values for read-only code and read-only data memory.
Note
This sum is the total flash memory usage for the application project. The read/write data memory is the total RAM usage by the application project.
- Note these values.
- Open the stack map file.
- Compute the same flash and RAM values for the stack project.
- Add the total flash memory value from the application with the total flash usage of the stack to determine the total system flash usage.
- Add the total RAM usage from the application with the stack to get the total system RAM usage.
For CCS, the map file of the respective project gives a summary of flash and RAM usage. To determine the remaining available memory for each project, see Flash and ram. Due to section placement and alignment requirements, some remaining memory may be unavailable. The map file memory usage is valid only if the project builds and links successfully.
Debugging Common Heap Issues
Warning
When using an auto sized heap, ROV Classic may report errors. Please see the TI-RTOS Object Viewer section for a workaround and more information.
As described in dynamic_memory_allocation, the Heap Manager and its heap are used to allocate messages between the Bluetooth Low Energy stack task and the application task and as dynamic memory allocations in the tasks, as well as in TI-RTOS.
Profiling functionality is provided for the heap but is not
enabled by default. Therefore, it must be compiled in by
adding HEAPMGR_METRICS to the defined preprocessor symbols. This
functionality is useful for finding potential sources for unexplained
behavior and to optimize the size of the heap. When HEAPMGR_METRICS is
defined, the variables and functions listed as follows become available.
OSAL Heap Global variables:
These variables are only available to the OSAL heap when HEAPMGR_METRICS
is enabled. Their descriptions are below.
- heapmgrBlkMax
- The maximum amount of simultaneous allocated blocks
- heapmgrBlkCnt
- The current amount of allocated blocks
- heapmgrBlkFree
- The current amount of free blocks
- heapmgrMemUB
- The furthest memory location of an allocated block, measured as an offset from the start of the heap
Heap Global variables:
These variables are available to all heap implementations when
HEAPMGR_METRICS is defined.
- heapmgrMemAlo
- The current total memory allocated in bytes
- heapmgrMemMax
- The maximum amount of simultaneous allocated memory in blocks (this value must not exceed the size of the heap)
- heapmgrMemFail
- The amount of memory allocation failure (instances
where
ICall_malloc()has returned NULL)
Furthermore when using a TI-RTOS based heap such as HeapMem or HeapTrack, there is additional debugging capability that can be used.
OSAL Heap Functions
Warning
Note the below functions are enabled only for the legacy OSAL heap, TI-RTOS based heap implementations offer native support for their functionality. Code based on TI-RTOS HeapMem or HeapTrack may not work with these calls.
Also note that these functions have not been updated for BLE5-Stack, and may not work as expected. This will be updated in the future.
This function returns the previously described variables in the pointers passed
in as parameters. HEAPMGR_METRICS must be defined to access these.
void ICall_getHeapMgrGetMetrics(uint32_t *pBlkMax, uint32_t *pBlkCnt,
                                uint32_t *pBlkFree, uint32_t *pMemAlo,
                                uint32_t *pMemMax, uint32_t *pMemUb);
Refer to ICall_getHeapMgrGetMetrics for more information.
The sanity check function will check the integrity of the OSAL heap. It reports 0 if the heap is sane and non zero otherwise.
int ICall_getHeapMgrSanityCheck();
Refer to ICall_getHeapMgrSanityCheck in doxygen for more information.
Common Heap Functions
However, the get stats function is available to all three supported heap configurations.
void ICall_getHeapStats(ICall_heapStats_t *stats);
Returns a pointer to the Heap statics structure.
The heap stats structure, is defined as below:
typedef struct
{
  uint32_t totalSize;
  uint32_t totalFreeSize;
  uint32_t largestFreeSize;
}ICall_heapStats_t;
Determining the Auto Heap Size
The following procedure can be used to view the size of the heap when the auto heap size feature is enabled.
The auto heap size feature takes advantage of linker file symbols to determine the optimal heap size, the user can determine the size of the auto heap via the generated map file using the procedure below:
The size of the heap is the difference between the address of the last item in the .bss section and the start address of the system stack (CSTACK). For example, the
20003f48  heapEnd
20001cc1  heapStart
The size of the heap in this example is defined as:
0x20003f48 - 0x20001cc1 = 0x2287 or 8839 bytes for the heap.
Note
The above procedure will work for any active heap implementation
Determining the auto heap size is slightly dependent on the heap implementation that is active, see the sections below to see how to determine the size of an auto sized heap at runtime.
OSAL HEAP
- Open the variable watch window and view
HEAPMGR_SIZE, it will report the heap size.
HeapMem or HeapMem + HeapTrack
- Using ROV, open the
HeapMem.Detailedview, the heap’s size is reported in the totalSize field. See TI-RTOS Object Viewer for more information on ROV and how to use it.
Programatically Accessing the Heap Configuration
The heap configuration variables can be accessed software to determine the active heap configuration and size at runtime. The code snippet below will print out the active heap config and the heap’s size.
1 2 3 4 5 6 7 8 9 10 11 12 13 14 15 16 17 18 19 20 21 22 | #include <xdc/cfg/global.h> // This is included to access cfg file variables
//...
// Get the HeapSize
ICall_heapStats_t stats;
ICall_getHeapStats(&stats);
if((HEAPMGR_CONFIG & 0x03) == 0x00)
{
Display_print0(dispHandle, 6,0, "Using Heap: OSAL");
}
else if ((HEAPMGR_CONFIG & 0x03) == 0x01)
{
Display_print0(dispHandle, 6,0, "Using Heap: HeapMem");
}
else if((HEAPMGR_CONFIG & 0x03) == 0x02)
{
Display_print0(dispHandle, 6,0, "Using Heap: HeapMem + HeapTrack");
}
Display_print1(dispHandle, 7,0, "Heap Size: %d", stats.totalSize);
|
Troubleshooting Heap Problems
Issues with dynamic allocated memory can be notoriously hard to track down and debug; this section aims to give tips on how to debug the most common issues with dynamic memory.
In general, HeapMem and HeapMem + HeapTrack offer more debuggability than the OSAL heap through the ROV tools, but have associated tradeoffs such as speed and overhead. If you suspect that there are heap issues, enable a more verbose heap implementation to help debug and root cause the issue.
- HeapTrack is a module built above the HeapMem module used to debug heaps, it offers the most debugging capability.
- HeapMem offers ROV support and has the ability to detect if the internal structure of the heap has become corrupted.
- OSAL heap offers APIs for logging heap metrics and stats
Reference the Heaps section of the BIOS User’s Guide for more information on the TI-RTOS provided heap implementations.
Writing to already freed memory
Pointers to memory which have already been freed using ICall_free() should
no longer be used. A common practice is to set pointers to NULL after they have
been freed, and check them for NULL before using them.
1 2 3 4 5 6 7 8 9 10 11 12 13 14 | // Allocate Memory
uint32_t *myPtr = ICall_malloc(500);
//..
// Later free the pointer, set it to NULL
ICall_free(myPtr);
myPtr = NULL;
// This check will protect against writing to already freed memory
if( NULL != myPtr)
{
*myPtr = 42;
}
|
When accessing memory that has already been freed, there is a risk that the internal structure of the heap will become corrupted. Let’s assume some code didn’t follow the above convention, and wrote to a free’d pointer.
The figure below shows how the user can use HeapMem to detect heap corruption with ROV, notice the dramatic change in freeSize.
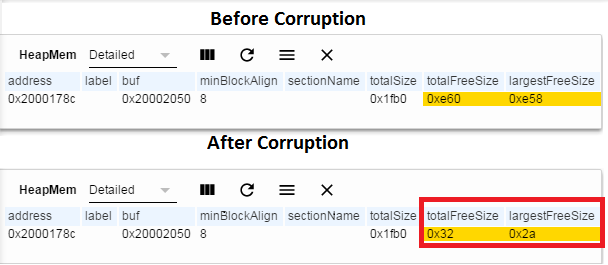
Figure 152. Writing to freed memory
Freeing Already freed Memory
The cause of this bug is the same as the one from the previous section, double frees will corrupt the internal structure of the heap.
1 2 3 4 5 6 7 | // Allocate Memory
uint32_t *myPtr = ICall_malloc(500);
//..
ICall_free(myPtr);
ICall_free(myPtr);
|
Starving the system/Memory Leak
Warning
Asserting during a heap failure may be considered dangerous in production code, however this section seeks to showcase its use in debugging.
If the protocol stack relies on dynamic allocation to pass messages between its internal layers and the application, starving the stack of memory may result in unexpected behavior. This can also negatively affect other application processes that require dynamic memory such as voice streaming.
The stack can be setup to assert when allocations fail by following the steps below:
- Include
hal_assert.cin the user application project- Define
EXT_HAL_ASSERTandMEM_ALLOC_ASSERT- Plug a handler function in
main.c, seemulti_role’s main function for an example
The code below will force this condition by mallocing without freeing.
1 2 3 4 5 | uint8_t i = 0;
while(i < 500)
{
ICall_malloc(500);
}
|
This condition can be caused by an application that calls malloc() during an
operation without a call to free() later in the code. Thus the code will keep
requiring more memory every time the operation runs without ever freeing any
memory. The above code snippet is an exaggerated example of this.
At the time of a failed allocation, a full call-stack is provided:
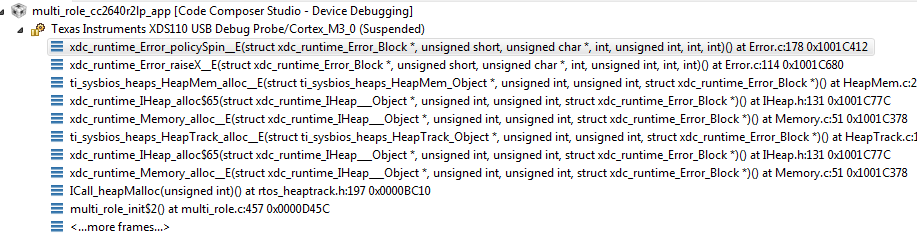
Figure 153. Alloc failed callstack
Checking the return value of malloc
When allocating memory on the heap using malloc, it is import to check it’s return value. Otherwise, this will often result in dereferncing a null pointer, which will result in an exception.
1 2 3 4 5 6 | uint8_t *myPtr = ICall_malloc(75);
if(NULL == myPtr)
{
// Error handling here
}
|
There are many more tips for debugging heap issues available in this TI-RTOS Debugging Workshop
ICall Abort
ICall abort is a function call used to indicate a serious failure in the ICall or OSAL mechanism used by the stack.
The BLE Stack will call ICall_abort() when one of the below happens:
- Calling a stack function through ICall in a stack callback or TI-RTOS SWI or HWI
- Misconfiguring of additional ICall tasks or entities
(usually when
OSAL_MAX_NUM_PROXY_TASKS + 1< than number of ICall tasks) - Incorrect ICall task registering
- Stack API call timed out while ICall is waiting for a response
- ICall encountered an error while executing a stack API
ICall_primSetTimer()orICall_setTimer()are unable to create a clock object
By default ICall_abort() will raise a HAL assert if they are enabled.
You can set a breakpoint in the HAL assert handler and inspect the call stack
to understand the function that called the abort.
If HAL asserts are not enabled then the abort function will spin lock.
The user can set a breakpoint in ICall abort to see what is causing the abort.
See the HAL Assert Handling section for more information.
HAL Assert Handling
The HAL Assert module defines a mechanism for handling undesirable or unrecoverable state states in the code. The HAL Assert module is intended to be configurable and shared between the application and stack.
HAL Assert Design
The HAL_ASSERT() macro from hal_assert.h can be used to process a
failure state or condition. The way this macro is evaluated corresponds to how
the HAL assert module is configured. There are two types of HAL Assert:
- Legacy HAL Assert
- Extended HAL Assert
Legacy HAL assert will execute the halAssertHandler() from hal_assert.c.
The implementation of halAssertHandler() is controlled by preprocessor
defines that are explained in the next section.
Extended HAL assert will execute halAssertHandlerExt() from
hal_assert.c. This extended handler will execute any user provided callbacks
before executing the default halAssertHandler(). The user provided
callback will contain information including the cause and subcause of the error.
The subcause can be set with the HAL_ASSERT_SET_SUBCAUSE() macro before
executing HAL_ASSERT().
Attention
TI recommends that extended HAL asserts are always used whenever possible to ensure the most debugging features.
HAL Assert configuration
The behavior of the HAL Assert module is based on both the selection of
preprocessor defines and the call to halAssertInit().
EXT_HAL_ASSERT: Enables extended HAL assertsHAL_ASSERT_RESET: Reset on assert usingHAL_SYSTEM_RESET()HAL_ASSERT_SPIN: Spinlock on assert usinghalAssertSpinlock()HAL_ASSERT_LIGHTSshould never be used.
To fully enable extended HAL Asserts halAssertInit() must be called with
HAL_ASSERT_LEGACY_MODE_DISABLED, otherwise the user supplied callback will
not be executed.
Recommended HAL Assert Configuration
TI recommends the following settings. Any other configuration is not recommended for new development.
EXT_HAL_ASSERTis defined in all BLE-Stack projects for of split-image and stack_library typehalAssertInit()should not be called by the application. Instead it is initialized by the stack inble_user_config.c(ble_user_config_stack.cfor examples that do not have a stack project).
The TI sample applications will plug a user callback for use
with the extended HAL assert in main.c using:
/* Register Application callback to trap asserts raised in the Stack */
RegisterAssertCback(AssertHandler);
The main.c file also contains an example AssertHandler() function.
The user is free to modify this function to meet the needs of their application,
but it should contain cases for all HAL assert types.
Hint
It is recommend to develop, debug, and vigorously stress test a product with asserts enabled. For production it is recommended that assert handling that results in a spinlock is removed.
Adding HAL Assert Support To the Application
Single Project
Define EXT_HAL_ASSERT in the app project predefined symbols list.
halAssertInit() is initilized by the stack in ble_user_config_stack.c
for examples that do not have a stack project.
Stack Library
In the stack library configuration, the stack and application images are
combined, and no action is needed to use HAL asserts in the application layer
or to plug the user call back using RegisterAssertCback(). (For stack
library configuration, there is no need to define EXT_HAL_ASSERT in the
app project.)
Split Image
The HAL assert code must live on both the stack and the application side in
order for the user to supply a callback via RegisterAssertCback() or to use
HAL asserts in the application. This includes
- Adding
hal_assert.cto the application project- Defining
EXT_HAL_ASSERTin the application project as a preprocessor symbol
HAL Assert Causes and Explanation
As mentioned above, the BLE-Stack will use HAL_ASSERT() to trap in the case
a failure state is encountered. By default, asserts will be sent to the
AssertHandler() function that is provided in main.c of the TI sample
applications. The table below describes the various HAL assert types that are
used in the stack and what they mean. This table assumes EXT_HAL_ASSERT
is defined as recommended above.
| HAL Assert Cause | Reason |
| HAL_ASSERT_CAUSE_OUT_OF_MEMORY | Malloc failed when HEAPMGR_METRICS and MEM_ALLOC_ASSERT are defined |
| HAL_ASSERT_CAUSE_OUT_OF_MEMORY | Critical callbacks cannot be allocated by the GAP central or peripheral link managers or SM |
| HAL_ASSERT_CAUSE_RF_DRIVER_ERROR | RF error callback is executed by RF driver. |
| HAL_ASSERT_CAUSE_ICALL_ABORT | ICall has encountered a critical error and needs to abort using ICall_abort().
See ICall Abort section for more information |
| HAL_ASSERT_CAUSE_ICALL_TIMEOUT | A stack API that was executed via ICall took longer than ICALL_TIMEOUT_PREDEFINE to return. This usually means that the stack has hung. |
| HAL_ASSERT_CAUSE_INTERNAL_ERROR | When a split image application executes an API call that is not available in the stack image. |
| HAL_ASSERT_CAUSE_UNEXPECTED_ERROR | Used by NPI UART and SPI transport layers to indicate the the driver is already in use |
HCI Hardware Errors
HCI Hardware errors are another mechanism by which the BLE-Stack may indicate that it has encountered an unrecoverable or unexpected state.
The stack will use ICall/OSAL to send a message to the app’s message queue with more information about the failure.
HCI hardware errors can be masked by the application using the
HCI_SetEventMaskCmd(), but this is not the default behavior.
Registering for HCI Hardware Errors
By default the TI provided sample applications will register for HCI events, and
process them using the _processStackMsg function within the application.
HCI hardware errors will be sent to the application as HCI_GAP_EVENT_EVENT
with an event code of HCI_BLE_HARDWARE_ERROR_EVENT_CODE. For more on
processing HCI events in the application, please see Host Controller Interface (HCI).
By default the sample applications will assert when a HCI Hardware error
is received, using the same assert handler as the extended HAL asserts
(AssertHandler()).
Decoding Hardware Error Reason
In the application’s _processStackMsg(ICall_Hdr *pMsg) function, there
is a case for HCI_GAP_EVENT_EVENT which has a subcase where
HCI_BLE_HARDWARE_ERROR_EVENT_CODE is processed.
The case for the hardware error processing can be enhanced to expose the error code like so:
case HCI_BLE_HARDWARE_ERROR_EVENT_CODE:
{
    hciEvt_HardwareError_t *hardCode =(hciEvt_HardwareError_t*)pMsg;
    AssertHandler(HAL_ASSERT_CAUSE_HARDWARE_ERROR, hardCode->hardwareCode);
}
A breakpoint can be set in this function to determine the error code. This
code should be reported to a TI engineer when experiencing a HCI hardware
assert. These error codes are defined in ll_common.h and hci.h.
Debugging RF Output
As mentioned in the CC13x0 CC26x0 SimpleLink Wireless MCU Technical Reference Manual, the RF output can be mapped to pins on the LaunchPad for RF signal debugging. These pins are intended to be used when connecting an RF range extender. However, they can also help in instances where it is unclear if the device is transmitting or receiving in the right window.
To enable RF output debugging, you will need to map the RF Core LNA enable and PA enable output or Tx start signals to a GPIO. See Listing 70. for an example of using DIO6 to output the LNA enable signal (logic high corresponds to an Rx) and DIO7 to output the Tx start (logic high corresponds to a Tx). These pins correspond to the Red (DIO6) and Green (DIO7) CC2640R2F LaunchPad LEDs and if the jumpers are connected, these LEDs will flicker to indicate RF activity. By connecting a logic analyzer to these pins, the RF activity over time can be recorded. If these pins are unavailable in your project, you can select any available DIO.
/*******************************************************************************
 * INCLUDES
*/
#include <driverlib/ioc.h>

// ...

int main()
{

    /*
     * Add the following after Board_initGeneral();
     * Be sure IOIDs used below are not used by any entries in PIN or
     * GPIO tables from the board files
     */

    // Map LNA enable pin RFC_GPO0 to DIO6
    IOCPortConfigureSet(IOID_6, IOC_PORT_RFC_GPO0,
                        IOC_IOMODE_NORMAL);
    // Map Tx start pin RFC_GPO3 to DIO7
    IOCPortConfigureSet(IOID_7, IOC_PORT_RFC_GPO3,
                        IOC_IOMODE_NORMAL);

    // ...

}
For more details, see the “External Signaling” chapter of the CC13x0 CC26x0 SimpleLink Wireless MCU Technical Reference Manual.
Packet Sniffer
In order to determine what is going on over the air, it’s recommended to have a packet sniffer that can track BLE advertisement packets as well as an established BLE connection.
Install the Required Software
Download and install the following software:
Important
It is important that you use the appropriate version of Wireshark. Please find the version you need in the SmartRF Packet Sniffer 2 User’s Guide, under ‘Getting Started > Installation’.
- SmartRF Packet Sniffer 2, which contains sniffer firmware for the CC13xx and CC26xx family
- Uniflash, used to program devices from the CC13xx and CC26xx family
- Flash Programmer 2, used to program devices from the CC13xx and CC26xx family
Required Hardware
Any device from the CC13x2 and CC26x2 family which supports BLE commands can be used as a sniffer. Following is a list of all supported development boards:
Uniflash Setup
- Connect the LaunchPad via USB
- Start Uniflash
- Connected device should be under ‘Detected Devices’. Click Start.
- If it is not, choose your device type from ‘New Configuration’. Click Start.
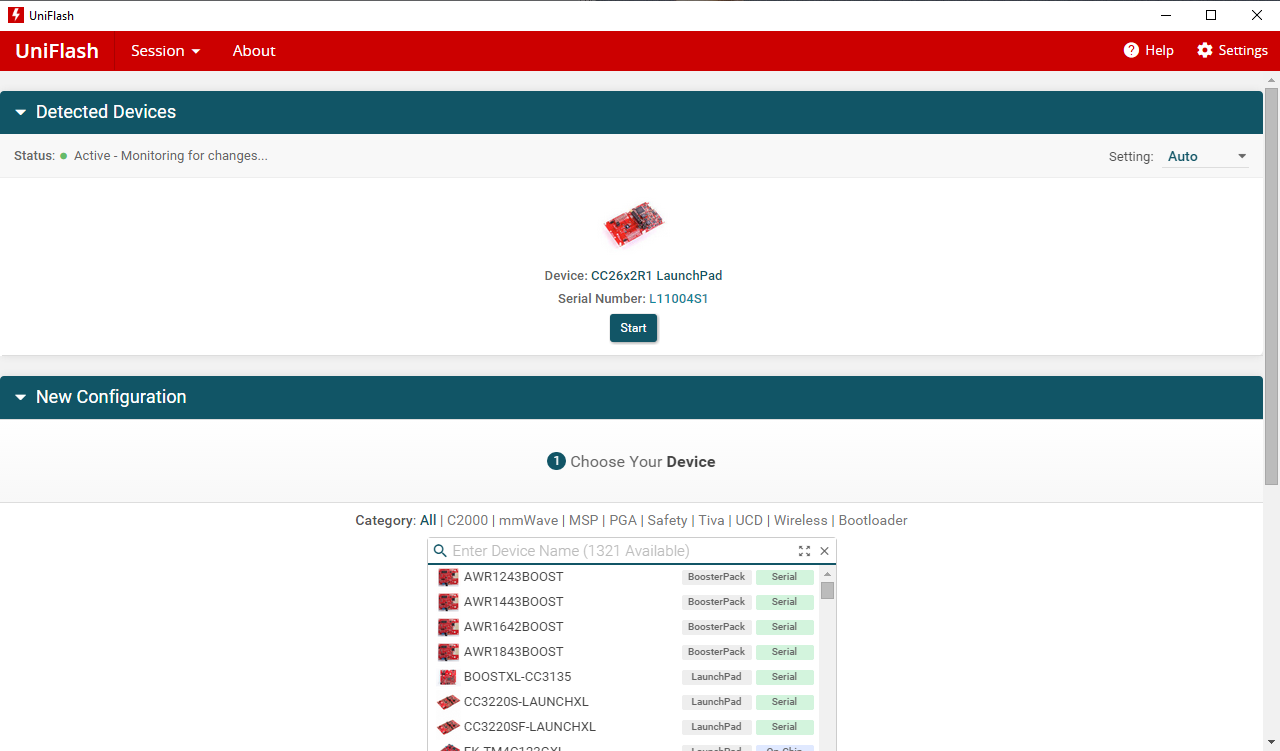
Figure 154. Connected Devices Displayed on Uniflash.
- Browse for the Flash image corresponding to your device under
<SmartRF Tools installpath>\SmartRF Packet Sniffer 2\sniffer_fw\bin. Click Load Image.
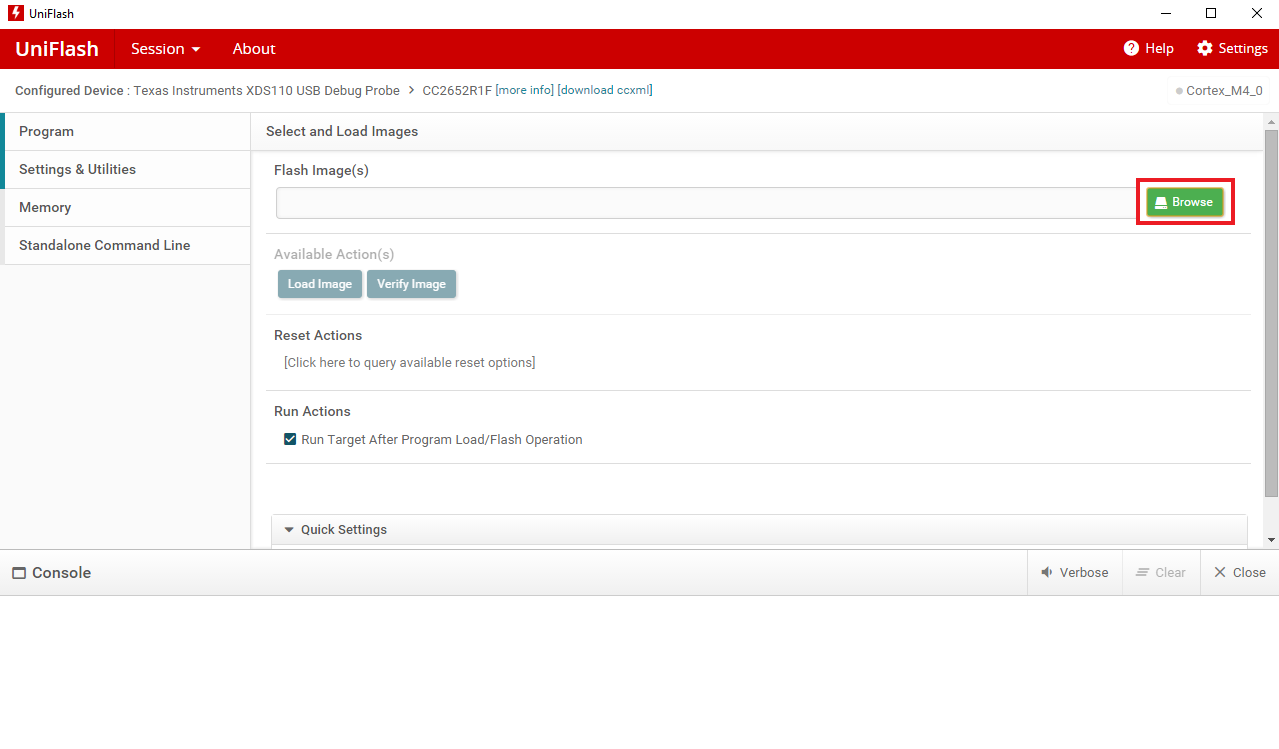
Figure 155. Browse for and Load Image on Uniflash.
SmartRF Sniffer Agent Setup
- Start SmartRF Sniffer Agent.
- Select Options->Data->Data Out. Check Use Pipe and click ‘OK’.
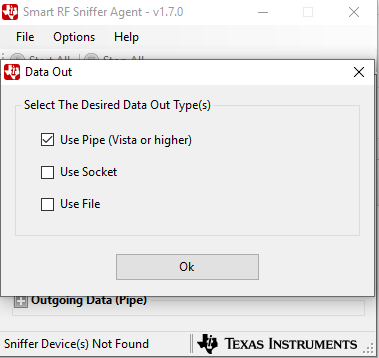
Figure 156. Select Use Pipe for Data Out
- Click Detect Devices to find the sniffer device.
- -If it does not show up, disconnect and reconnect the device and try again.
- Once your device is discovered click the checkbox under ‘Use’ and then click ‘Configure’.
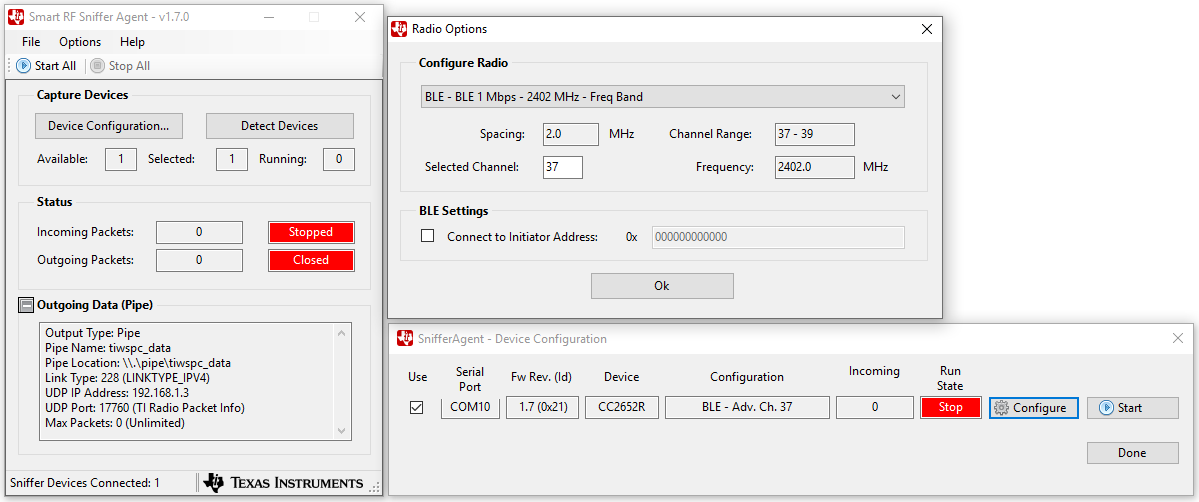
Figure 157. Configure the Sniffer Device
- Use the settings shown for BLE configuration.
-For BLE, use advertising channel 37, 38, or 39. -The sniffer can be configured to follow a connection between a specific BLE Central (initiator) and Peripheral device. Click the checkbox next to ‘Connect to Initiator Address’ and write the address of the Central (Initiator) device. The address of the device is printed to the display in most of our examples, but can also be found using an external tool such as the SimpleLink Starter mobile app. If this option is not selected, the device will follow the first connection that appears on the channel that was selected.
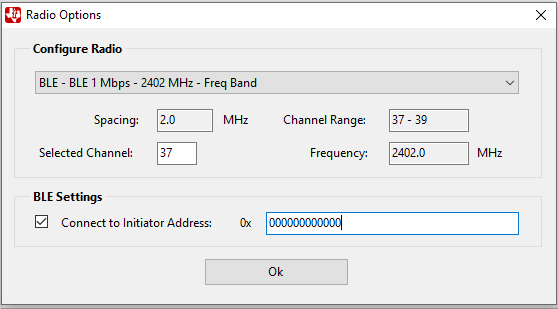
Settings for BLE configuration.
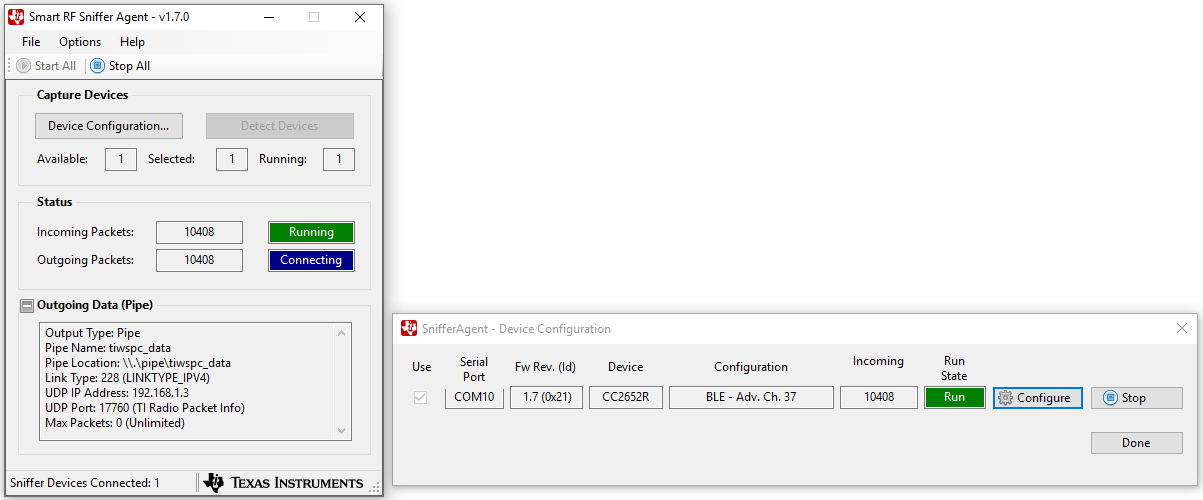
Click ‘OK’, then press ‘Start All’. -The ‘Incoming Packets’ indicator should turn green, and the ‘Outgoing Packets’ indicator should turn blue. Shown below.~
Wireshark Setup
- Create a new Wireshark desktop shortcut. Modify the Target setting by adding
-i\\.\pipe\tiwspc_data -kto the end of the current target entry.
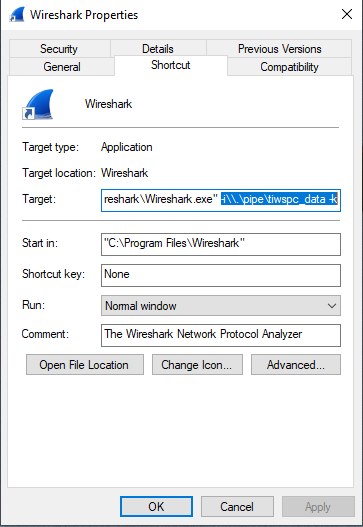
Figure 158. Modifying the target entry.
- Run Wireshark from the new shortcut.
- The packets should now be displayed.
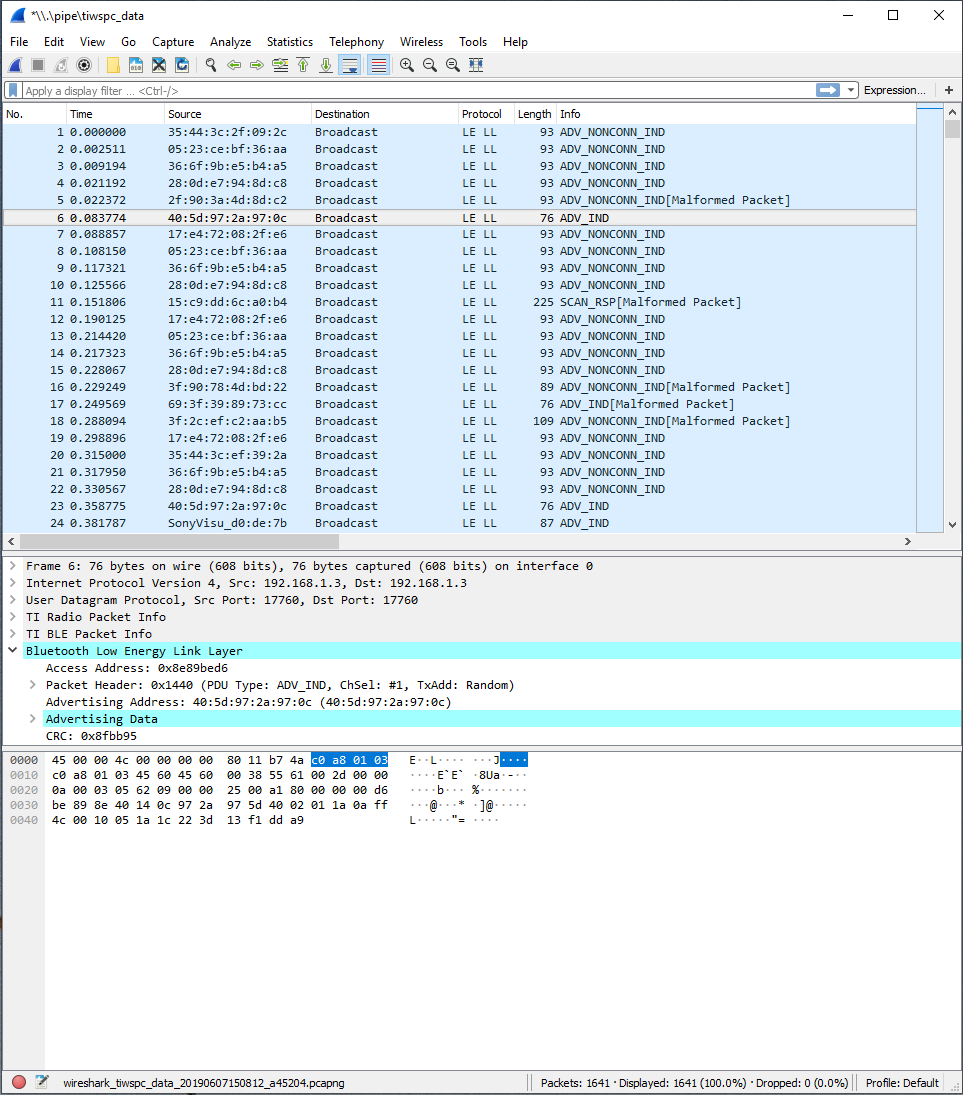
Figure 159. Example BLE packets displayed using Wireshark.