## Introduction
<br>
This module covers the basics of debugging an MCU+ SDK application in Code Composer Studio (CCS) using the tools provided by the SDK and CCS.
<hr>
## Import the GPIO Interrupt example
<br>
In this module, we will be using the GPIO Interrupt example for the R5F0-0 core as an example where applicable, so let's begin by importing this example into the workspace and loading it onto the device.
1. In CCS, go to *View → Resource Explorer* to open Resource Explorer
<hr style="width:50%; margin: auto;" />
2. In Resource Explorer, navigate to *MCU+ SDK → Development Tools → {Board} → drivers → gpio → gpio_input_interrupt → gpio_input_interrupt* and click **Import.**
<hr>
## Disable Code Optimization
First, let's disable code optimization.
<br>
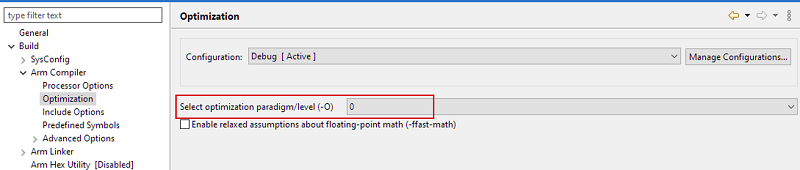
When code optimization is enabled in the project, sometimes the breakpoint cannot be set to the exact line in the C source code and stepping through code can be unpredictable. This is because the optimizer may condense code and impact the correlation between the assembly instruction and the C source. Due to this, it is recommended to turn off compiler optimization when debugging code.
* To disable optimization, right-click the project → *Show Build Settings* and go to *Build → Arm Compiler → Optimization* and set the optimization level to 0 and rebuild the project.
<br>
<br>
<hr>
## Build and Load the GPIO Interrupt example
<br>
Click the **Debug** icon to build the project and load it onto the R5F0-0 core.

<hr>
## Setting Breakpoints
To open the Breakpoints view: *View → Breakpoints*
<br>
Breakpoints allow you to halt the execution of a core at a pre-defined place in the code. They can be set at a line in a source file, which gets translated to an address in the device memory, or directly at an address on the Disassembly view.
To toggle a breakpoint, either double-click on the left side of either the line number in the source code view or the address in the disassembly view, or right-click → *Toggle Breakpoint.*
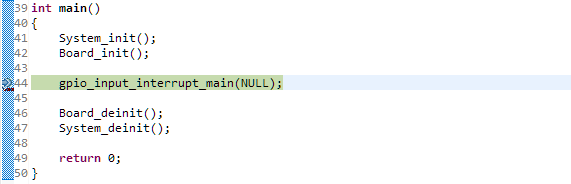
For example, set a breakpoint at line 44 at `gpio_input_interrupt_main()` and click Resume (F8) to run the program. You will see CCS halt the program once it has reached this line.
<hr>
## Stepping Through Code
<br>
CCS allows you to single-step through the code in your program. With the breakpoint set at `gpio_input_interrupt_main()` from the previous section, select **Run > Step Into** to step into `gpio_input_interrupt_main()`.
You can also select **Run > Step Over** which will execute the function in a single step. This is useful when you don't want to enter a certain function when single-stepping through your code.
<hr>
## Setting Watchpoints
<br>
Watchpoints are a special category of hardware breakpoints that can be triggered for a particular memory read or write. Watchpoints are shown in the Breakpoints view.
Watchpoints are extremely useful to catch exceptions, invalid memory boundary accesses, overrun buffers, etc. and can be set to access any memory region, including Memory Mapped Registers (MMRs).
* To set a Watchpoint, highlight a variable in the source code editor, right click and select *Breakpoint → Hardware Watchpoint*.
* For example, right click on the variable `gGpioIntrDone` and add a watchpoint. Whenever you press the GPIO push button, a breakpoint will trigger when `gGpioIntrDone` increments at the line `gGpioIntrDone++;` in `GPIO_bankIsrFxn()`
<br>

<br>
<hr>
## Watching and Editing Variables, Expressions, and Registers
Variables, expressions, and registers can be monitored in CCS - this section covers the various ways to do this.
<br>
### Variables View
To open the Variables view: *View → Variables*
<br>
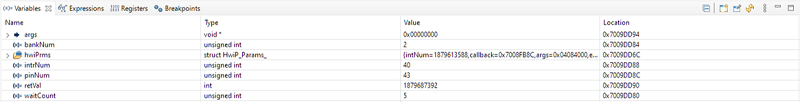
The Variables view shows only **Local** variables that belong to the function currently being executed.
To see an example of this, set a breakpoint inside `gpio_interrupt.c` in `gpio_input_interrupt_main()` and in the ISR `GPIO_bankIsrFxn()`.
Run the program and let it halt at the first breakpoint in `gpio_input_interrupt_main()`. Take a look a the variables listed in the Variables view - notice it shows the variables local to this function.
<br>
<br>
Now resume the program and press the GPIO push button on the board to trigger the interrupt and enter the ISR. The program will halt at the breakpoint in the ISR. You will notice the variables listed in the Variables view have now changed to show the variables local to the ISR function.
<br>

<br>
You can modify the value of a variable directly from the Variables view. Variables whose values have changed since the last time they were seen are highlighted in yellow.
<hr style="width:50%; margin: auto;" />
### Expressions View
To open the Expressions view: *View → Expressions*
<br>
The Expressions view allows you to watch **local, global,** and **static variables,** **C-valid expressions,** and **registers**.
To see an example of this, add the variable `intrStatus` to the Expressions view. To add a variable, click "Add new expression" and type in `intrStatus`.
<br>

<br>
Expressions whose values have changed since the last time they were seen are highlighted in yellow. You can modify the value of an expression directly from the Expressions view.
<hr style="width:50%; margin: auto;" />
### Registers View
To open the Registers view: *View → Registers*
<br>
The Registers view allows for viewing and editing the contents of core and peripheral registers of the device, including bitfields and individual bits.
To change a register or register bit field value, single click in the value column of the register and modify it. Register values that have changed are highlighted in yellow. Note, this is not allowed for registers that are read-only.
<hr>
## Disassembly view
To open the Disassembly view: *View → Disassembly*
<br>
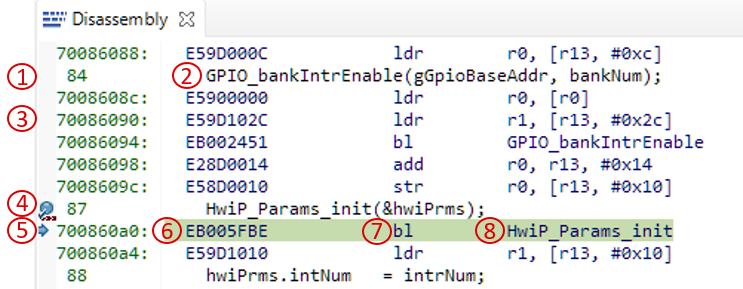
The Disassembly view is an integral part of the debugger that translates machine language into assembly language, as it displays the disassembled instructions and symbolic information needed for debugging.
<br>
<br>
The Disassembly view contains several points of information:
**1.** Line numbers of the source file in context
**2.** C source code at the line number
**3.** Program addresses
**4.** Breakpoint indicators
**5.** Program Counter - the next instruction to be executed
**6.** Opcodes in hex format
**7.** Disassembled instructions
**8.** If the opcode references a function or variable, their names are also shown
<hr>
## Memory Browser view
To open the Memory Browser view: *View → Memory Browser*
<br>
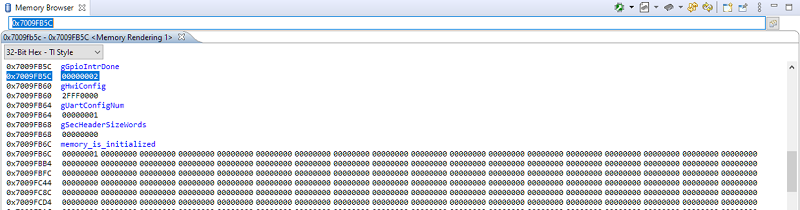
The Memory Browser view is another integral part of the debugger that shows the contents of the target memory starting at a specified address and with various data formatting features.
To use it, enter an address in the Address Text box at the top of the view. The contents of a selected memory location can be edited by double-clicking the value.
<br>
<br>
It features multiple viewing formats and types:
* chars
* integers (signed/unsigned)
* floats
* multiple hexadecimal data sizes (8 through 64-bits).
Additional capabilities include:
* memory fill with predefined values
* saving to and loading from files on the host PC
* viewing of all variables and functions
* a context-sensitive information box for every memory position
<hr>
## Stepping Through Library Code
<br>
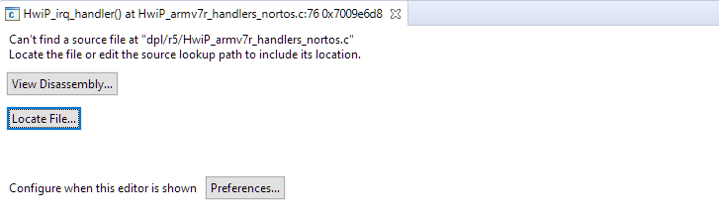
When stepping through your application or after halting it, the editor view may show the message *Can’t find a source file at...* or *No source available for...* and in the same view it will also typically show the buttons *View Disassembly…* and *Locate File…*
<br>
<br>
The reason for this message is that the program is halted at a location where the debugger is unable to locate the corresponding source file. This is typical when halted within a library that was built outside of the main project, i.e., a library that is linked to the application.
To view the source code, click *Locate File...* and select the folder that contains the source file to view the code and to continue stepping through the code.
In this example, the editor is indicating it can't find the source file at `dpl/r5/HwiP_armv7r_handles_nortos.c` so click *Locate File...* and navigate to `<SDK_INSTALL_DIR>/source/kernel/nortos/` to open the source code in the editor view and continue stepping through the code.
<hr>
## Hiding Cores
<br>
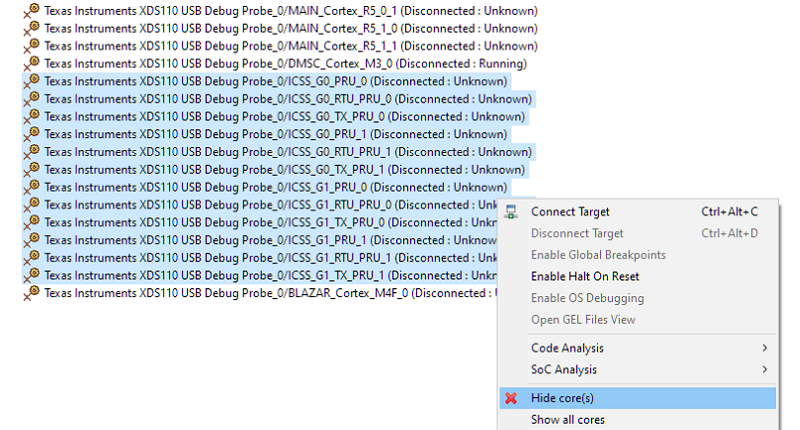
In the Debug view, it is possible to hide cores that will not be used. This helps to avoid clutter in the view to avoid accidentally selecting a debug context of a core that is not being used.
To hide cores, multi-select the cores to hide, right-click → *Hide core(s)*.
<br>
<br>
<hr>
## Debug Logging
<br>
The Driver Porting Layer (DPL) contains a **Debug Log** module that provides APIs for debug logging and is the recommended method for providing "printf" style.
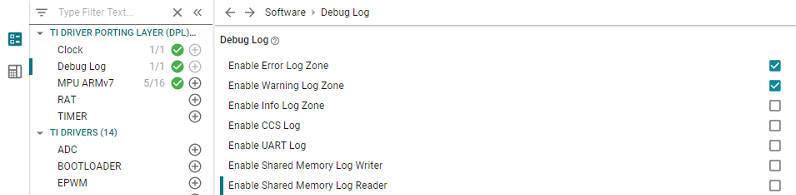
This section covers the various options supported by the Debug Log Module. These options can be configured in the SysConfig GUI under *TI Driver Porting Layer (DPL) → Debug Log.*
**Note:** Log and assert APIs should not be called from an ISR context.
<br>
<br>
There are 3 logging methods supported by the Debug Log module:
<hr style="width:50%; margin: auto;" />
### 1. CCS Console Logging (via JTAG)
<br>
To enable logging to the CCS Console, check "Enable CCS Log." To open the CCS console, click *View &rarr; Console.*
<hr style="width:50%; margin: auto;" />
### 2. UART Logging
<br>
To enable UART logging, check "Enable UART Log." This will automatically add a UART driver instance to be used with the logger.
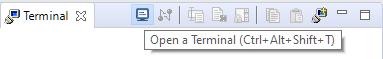
To view the UART Log output, open the CCS Terminal by going to *View &rarr; Terminal*. In the Terminal window, click "Open a Terminal" and configure the Terminal based on the UART settings in SysConfig.
<br>
<br>
The default UART terminal settings are:
* Baud Rate: 115200
* Data Length: 8-bit
* Parity Type: None
* Stop Bit: 1-bit
* Flow Control: None
<hr style="width:50%; margin: auto;" />
### 3. Shared Memory Logging
<br>
The Shared Memory Logger allows you to share and output logs with other cores in the device.
* **Shared Memory Log Writer** - Logs the debug output to shared memory. Another core should have the Shared Memory Log Reader enabled to read the debug log strings.
* **Shared Memory Log Reader (FreeRTOS only)** - Reads the string logged by another core and outputs it to the logs selected on the core. This needs task support so the reader core needs to be running FreeRTOS.
A core can only be designed as a reader or writer, not both. When a core has the Shared Memory Log Reader enabled, the option to use the Shared Memory Writer is ignored.
When the Shared Memory Logger is enabled, SysConfig generates the shared memory section to be used for logging in `ti_dpl_config.c`
```c
`DebugP_ShmLog gDebugShmLog[CSL_CORE_ID_MAX] __attribute__((aligned(128), section(".bss.log_shared_mem")));`
```
This section `.bss.log_shared_mem` from the above code snippet needs to be reserved for shared memory logging and needs to be allocated at the same shared memory address location for all cores.
This section can be reserved in the linker command file:
```c
SECTIONS
{
...
`.bss.log_shared_mem (NOLOAD) : {} > LOG_SHM_MEM`
...
}
MEMORY
{
...
LOG_SHM_MEM : ORIGIN = 0x701D4000, LENGTH = 0x00004000
...
}
```
This section also needs to be marked as non-cache in the MPU/MMU module.
<hr style="width:50%; margin: auto;" />
### Log Zones
<br>
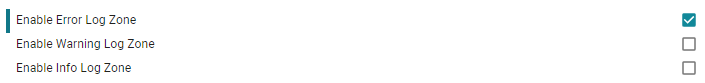
The Debug Log module has support for "Log Zones," which allows for enabling and disabling different types of debug log messages. These Log Zones are used in the SDK drivers but can also be used in the application. The following Log Zones are supported:
* Error Log Zone
* Warning Log Zone
* Info Log Zone
Having the debug log messages separated into different zones gives users the ability to easily change the verbosity of the drivers and application.
<br>
<hr style="width:50%; margin: auto;" />
### Asserts
<br>
The Debug Log module also allows for assert testing - if a given expression is evaluated to 0, the application will disable interrupts and loop forever. It will also log the file name and line number where the assert occured.
```c
DebugP_assert(expression)
```
<br>
If logging is not enabled or desired, the following API can be used instead.
```c
DebugP_assertNoLog(expression)
```
<hr>
## []{ } Knowledge Check
<br>
**1.** To monitor global variables, which view should be used?
[quiz]
x Variables view --> Incorrect
v Expressions view --> Correct!
x Registers view --> Incorrect
[quiz]
<br>
**2. True or False:** Debug Log APIs can be called from an ISR context.
[quiz]
x True --> Incorrect
v False --> Correct!
[quiz]
<br>
**3. True or False:** The Shared Memory Log Reader requires FreeRTOS.
[quiz]
v True --> Correct!
x False --> Incorrect
[quiz]
<hr>
## Additional Reading
<br>
##### CCS User Guide: [Debug](https://software-dl.ti.com/ccs/esd/documents/users_guide/index_debug.html)
##### MCU+ SDK User Guide: [Debug](https://software-dl.ti.com/mcu-plus-sdk/esd/AM243X/latest/exports/docs/api_guide_am243x/KERNEL_DPL_DEBUG_PAGE.html)
<br/>
<hr>
{{r> [Back to Home](../overview.html)}}
{{r **Was this helpful? Let us know here:** [mcu_plus_academy_feedback@list.ti.com](mailto:mcu_plus_academy_feedback@list.ti.com)}}
<div align="center" style="margin-top: 4em; font-size: smaller;">
<a rel="license" href="https://creativecommons.org/licenses/by-nc-nd/4.0/"><img alt="Creative Commons License"
style="border-width:0" src="..//web_support/cc_license_icon.png" /></a><br />This work is licensed under a <a
rel="license" href="https://creativecommons.org/licenses/by-nc-nd/4.0/">Creative Commons
Attribution-NonCommercial-NoDerivatives 4.0 International License</a>.</div>