EnergyTrace User Guide
EnergyTrace ™ technology is a power analyzer tool for CCS that measures the application’s current consumption. The tool can be used stand-alone as a power profiling tool, or in EnergyTrace++ mode within a debug session for code analysis to help optimize the application for ultra-low-power consumption.
For further information regarding the EnergyTrace Tool, see the EnergyTrace Tool page. Additionally, please visit further EnergyTrace documentation at EnergyTrace overview.
EnergyTrace stand-alone Instructions
The following discusses the necessary steps to use EnergyTrace in stand-alone-mode on CC13x2 or CC26x2 LaunchPad. In stand-alone mode (EnergyTrace mode), the debugger is not active and the displayed current consumption is what to expect for the final application. As opposed to EnergyTrace++ where the debug interface on the device is active and the current consumption from the debugger will be added to the displayed current.
Flash the target device with the application to be analyzed.
Make sure no debug session is active and click the EnergyTrace Button as seen in Figure 81.
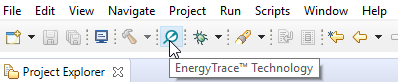
Figure 81. Start EnergyTrace
A dialog with instructions on how to use EnergyTrace Stand-alone Measurement Mode will pop-up. Click
Proceedto continue.The first time EnergyTrace is being used within a CCS Workspace some settings needs to be set. In the EnergyTrace Window, click on the
Advanced Menuicon and selectPreferences, as Figure 82. shows.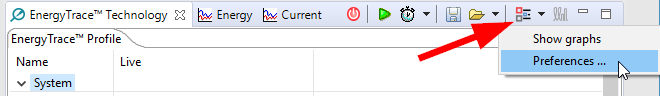
Figure 82. EnergyTrace Preferences menu
Under
Target Connection, setConnectiontoXDS110andVoltageto 3300.0 mV.ET-HDR Range Selectorshall be set toLow current, narrower range higher accuracy. If you want to save the captured data to a .cvs-file for further analysis, selectRaw data to CSV file. You can also select the battery cell type the application will be using to get an estimated life time of the application. ClickOkto save the preferences.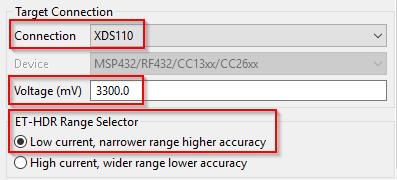
Figure 83. EnergyTrace Settings
Select how long you want to capture data by clicking the
Select Measurement
Duration
button as in Figure 84.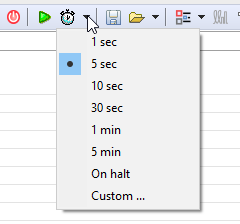
Figure 84. Select Measurement Duration
To start capturing data, click the green play button.
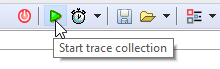
Figure 85. Start trace collection
When EnergyTrace is finished capturing data, review the application’s power profile and have a closer look in the Current graph. Figure 86. shows a zoomed-in current graph of BLE advertising.
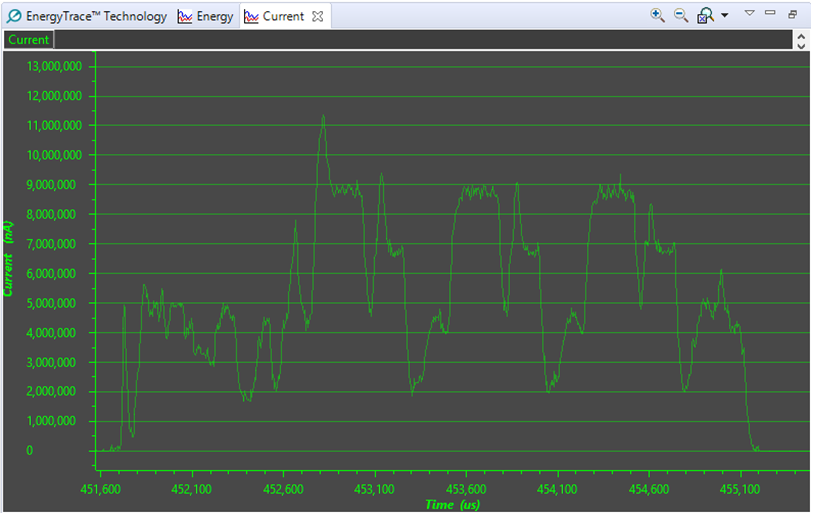
Figure 86. EnergyTrace Current Graph
EnergyTrace++ Instructions
To run EnergyTrace++, which allows more detailed data regarding power consumption, the Target Configuration file must be configured to allow for a different debugging interface. Specifically, to use EnergyTrace++, the debugger must be set to 4-pin cJTAG mode. The following discusses the necessary steps to modify the Target Configuration file and view EnergyTrace++ data on CC13x2 or CC26x2 LaunchPad.
Warning
In EnergyTrace++ mode, the displayed current consists of the application current consumption AND the device debugger current consumption. Use EnergyTrace stand-alone mode to display only the application current consumption.
EnergyTrace++ Update Target Configuration Instructions
In the CCS, using the Project Explorer, navigate to the
targetConfigsfolder.Double click on the
*.ccxmlfile to open a configuration menu as seen in Figure 87.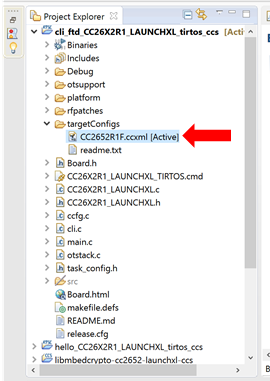
Figure 87. Open .ccxml file
On the bottom of the window, navigate to the
Advancedtab as seen in Figure 88.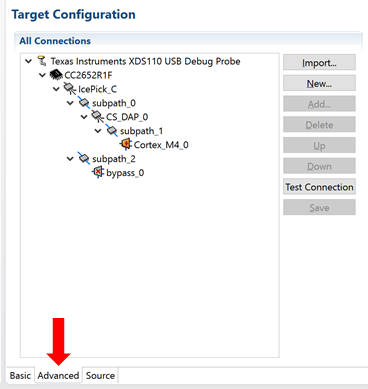
Figure 88. Navigate to Advanced Settings Tab
In the
All Connectionswindows pane, click on the highest level from the list tree as seen in Figure 89.In the
Connection Propertieswindow pane, modify theJTAG/SWD/cJTAG Modeparameter tocJTAG (1149.7) 4-pin standard modefrom the dropdown menu as seen in Figure 89.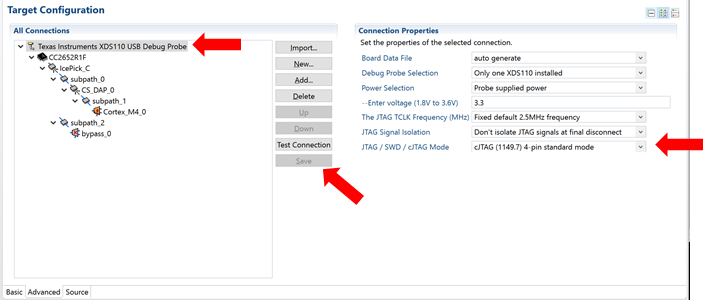
Figure 89. Configure 4-pin cJTAG Mode
After selecting this option, click
Savein the previousAll Connectionswindow pane.Close the
.ccxmlfile.
Using EnergyTrace++ Instructions
This section assumes the user has already configured their Target Configuration
settings to point use cJTAG (1149.7) 4-pin standard mode as described in
the EnergyTrace++ Update Target Configuration Instructions section above.
After the Build has successfully completed,
Debugthe project.Open the EnergyTrace Tool by clicking the button seen below in Figure 90.
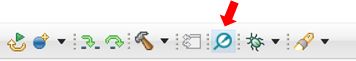
Figure 90. Enable EnergyTrace Tool
On the far right of the
EnergyTrace Technologywindow, click theSwitch to EnergyTrace++button as seen in Figure 91.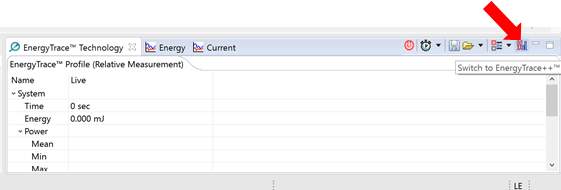
Figure 91. Switch to EnergyTrace++ Mode
You should see an additional
Statestab popup.Run the Debug session, click the green arrow button (F8).
You should now be able to observe the enhanced EnergyTrace++ details in the
EnergyTrace TechnologyandStatestabs as seen in Figure 92. and Figure 93.
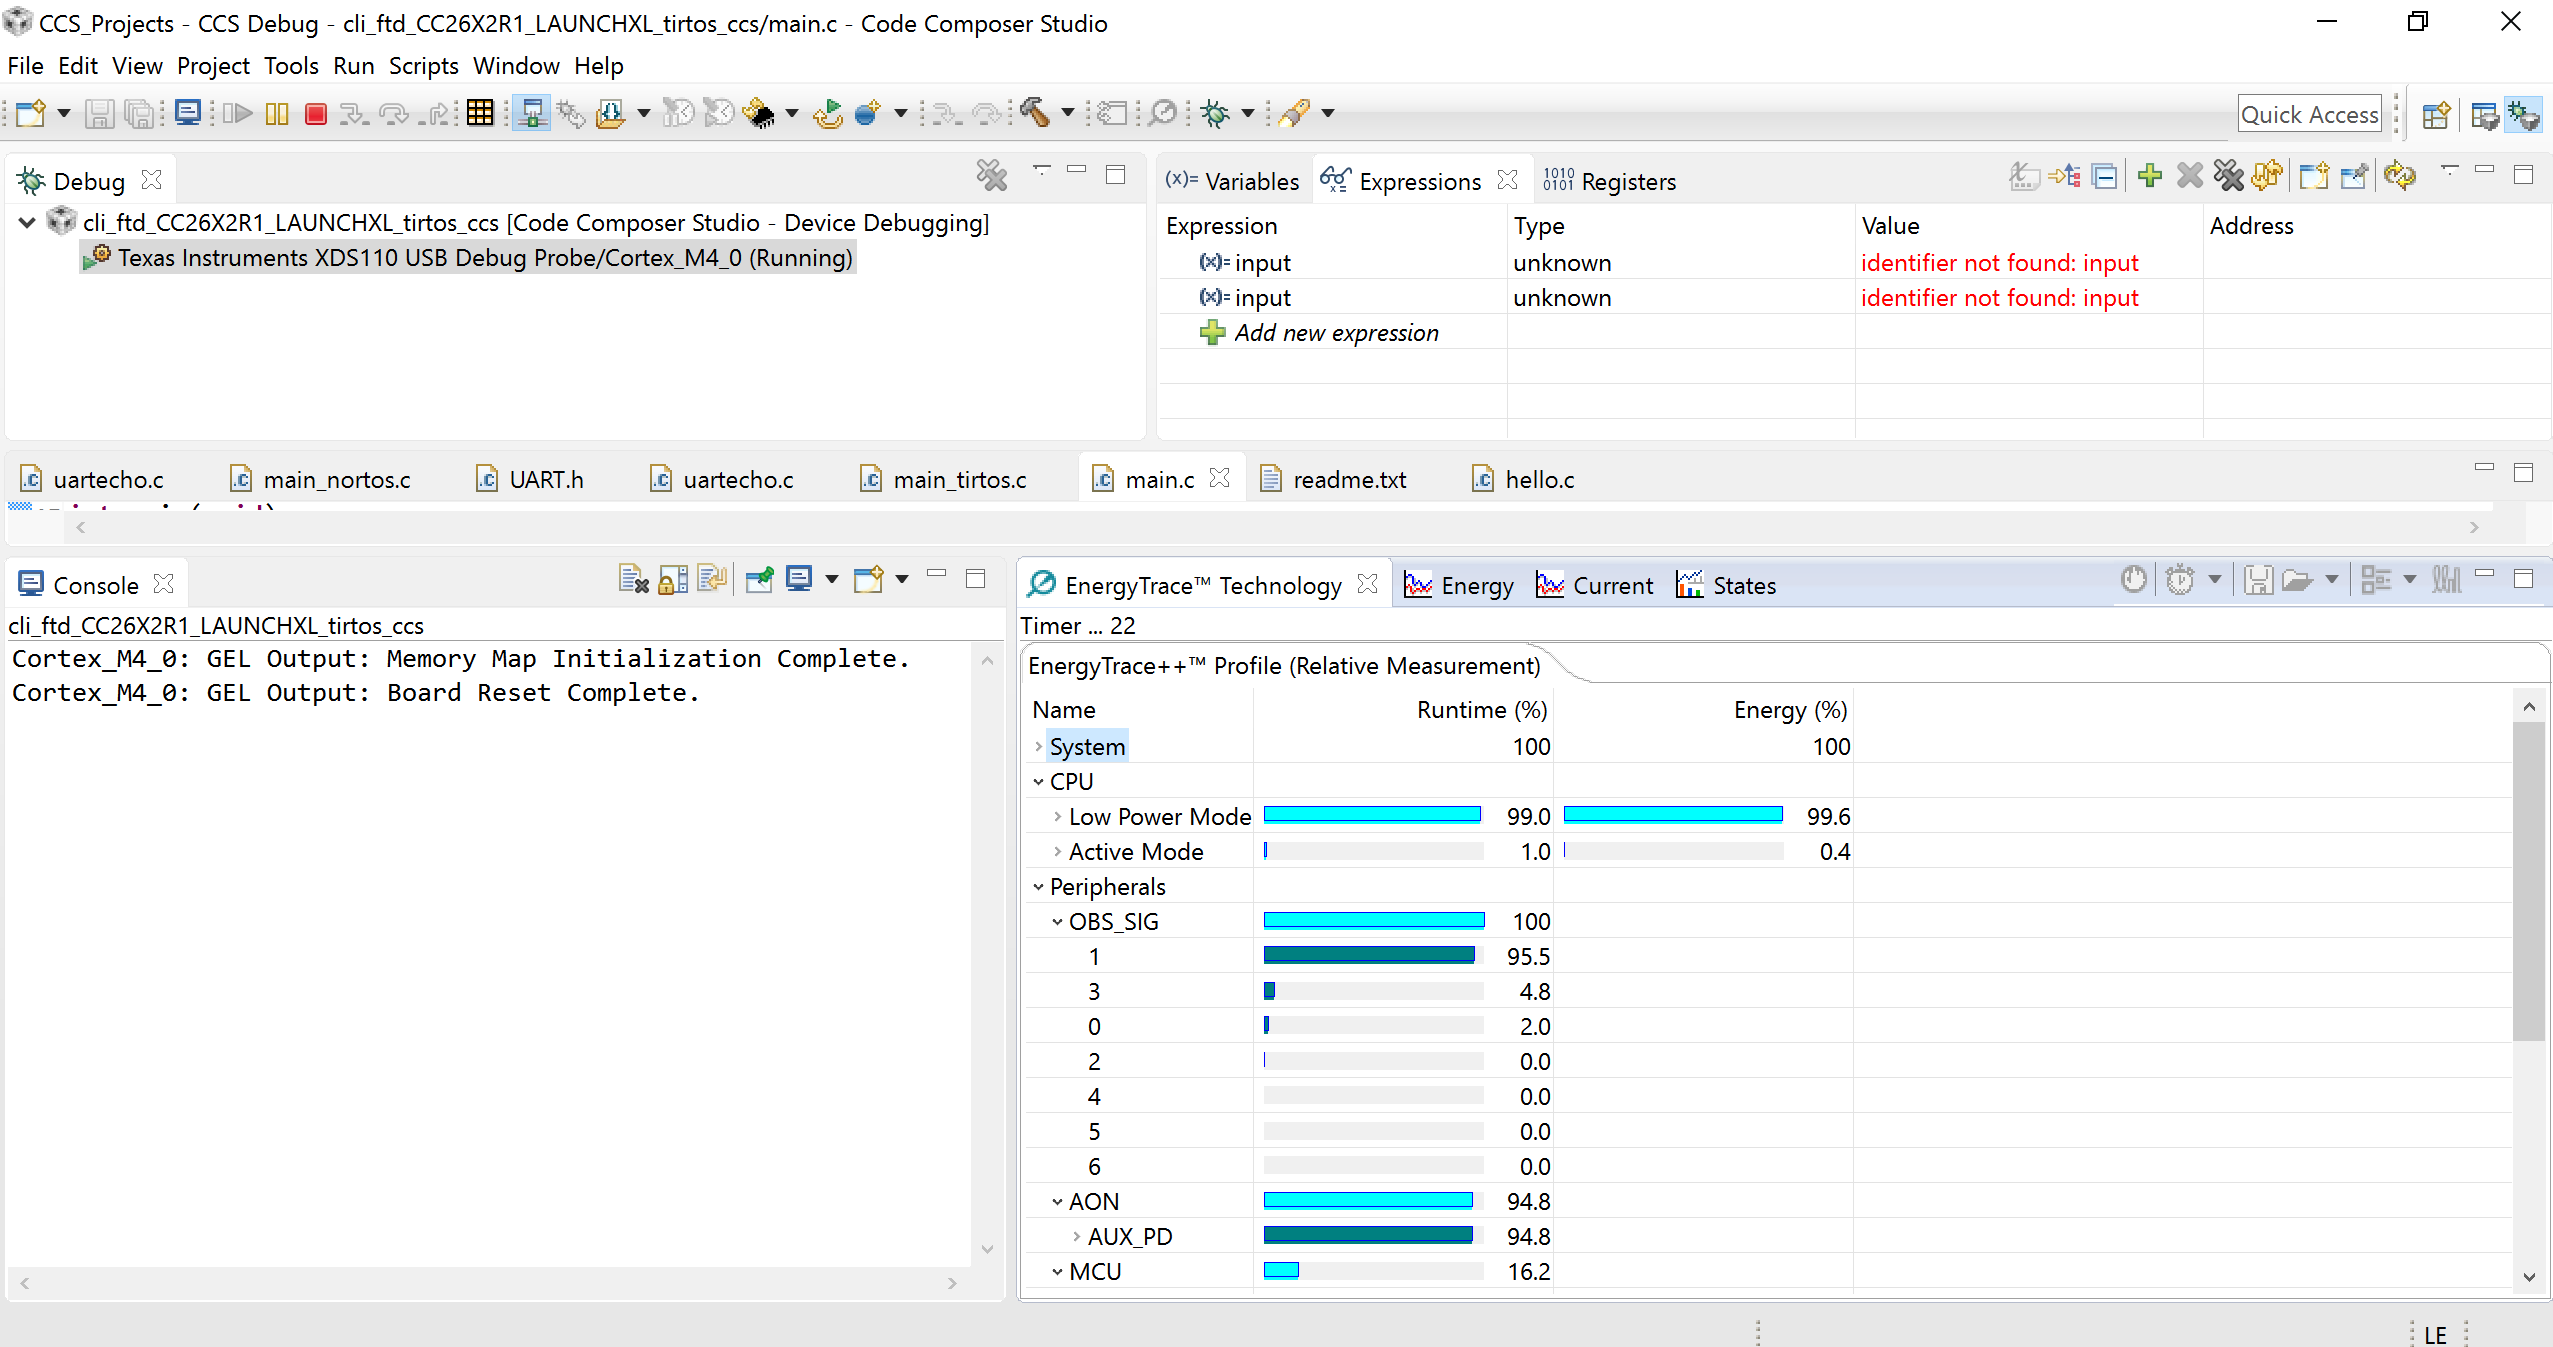
Figure 92. Sample EnergyTrace++ Tab
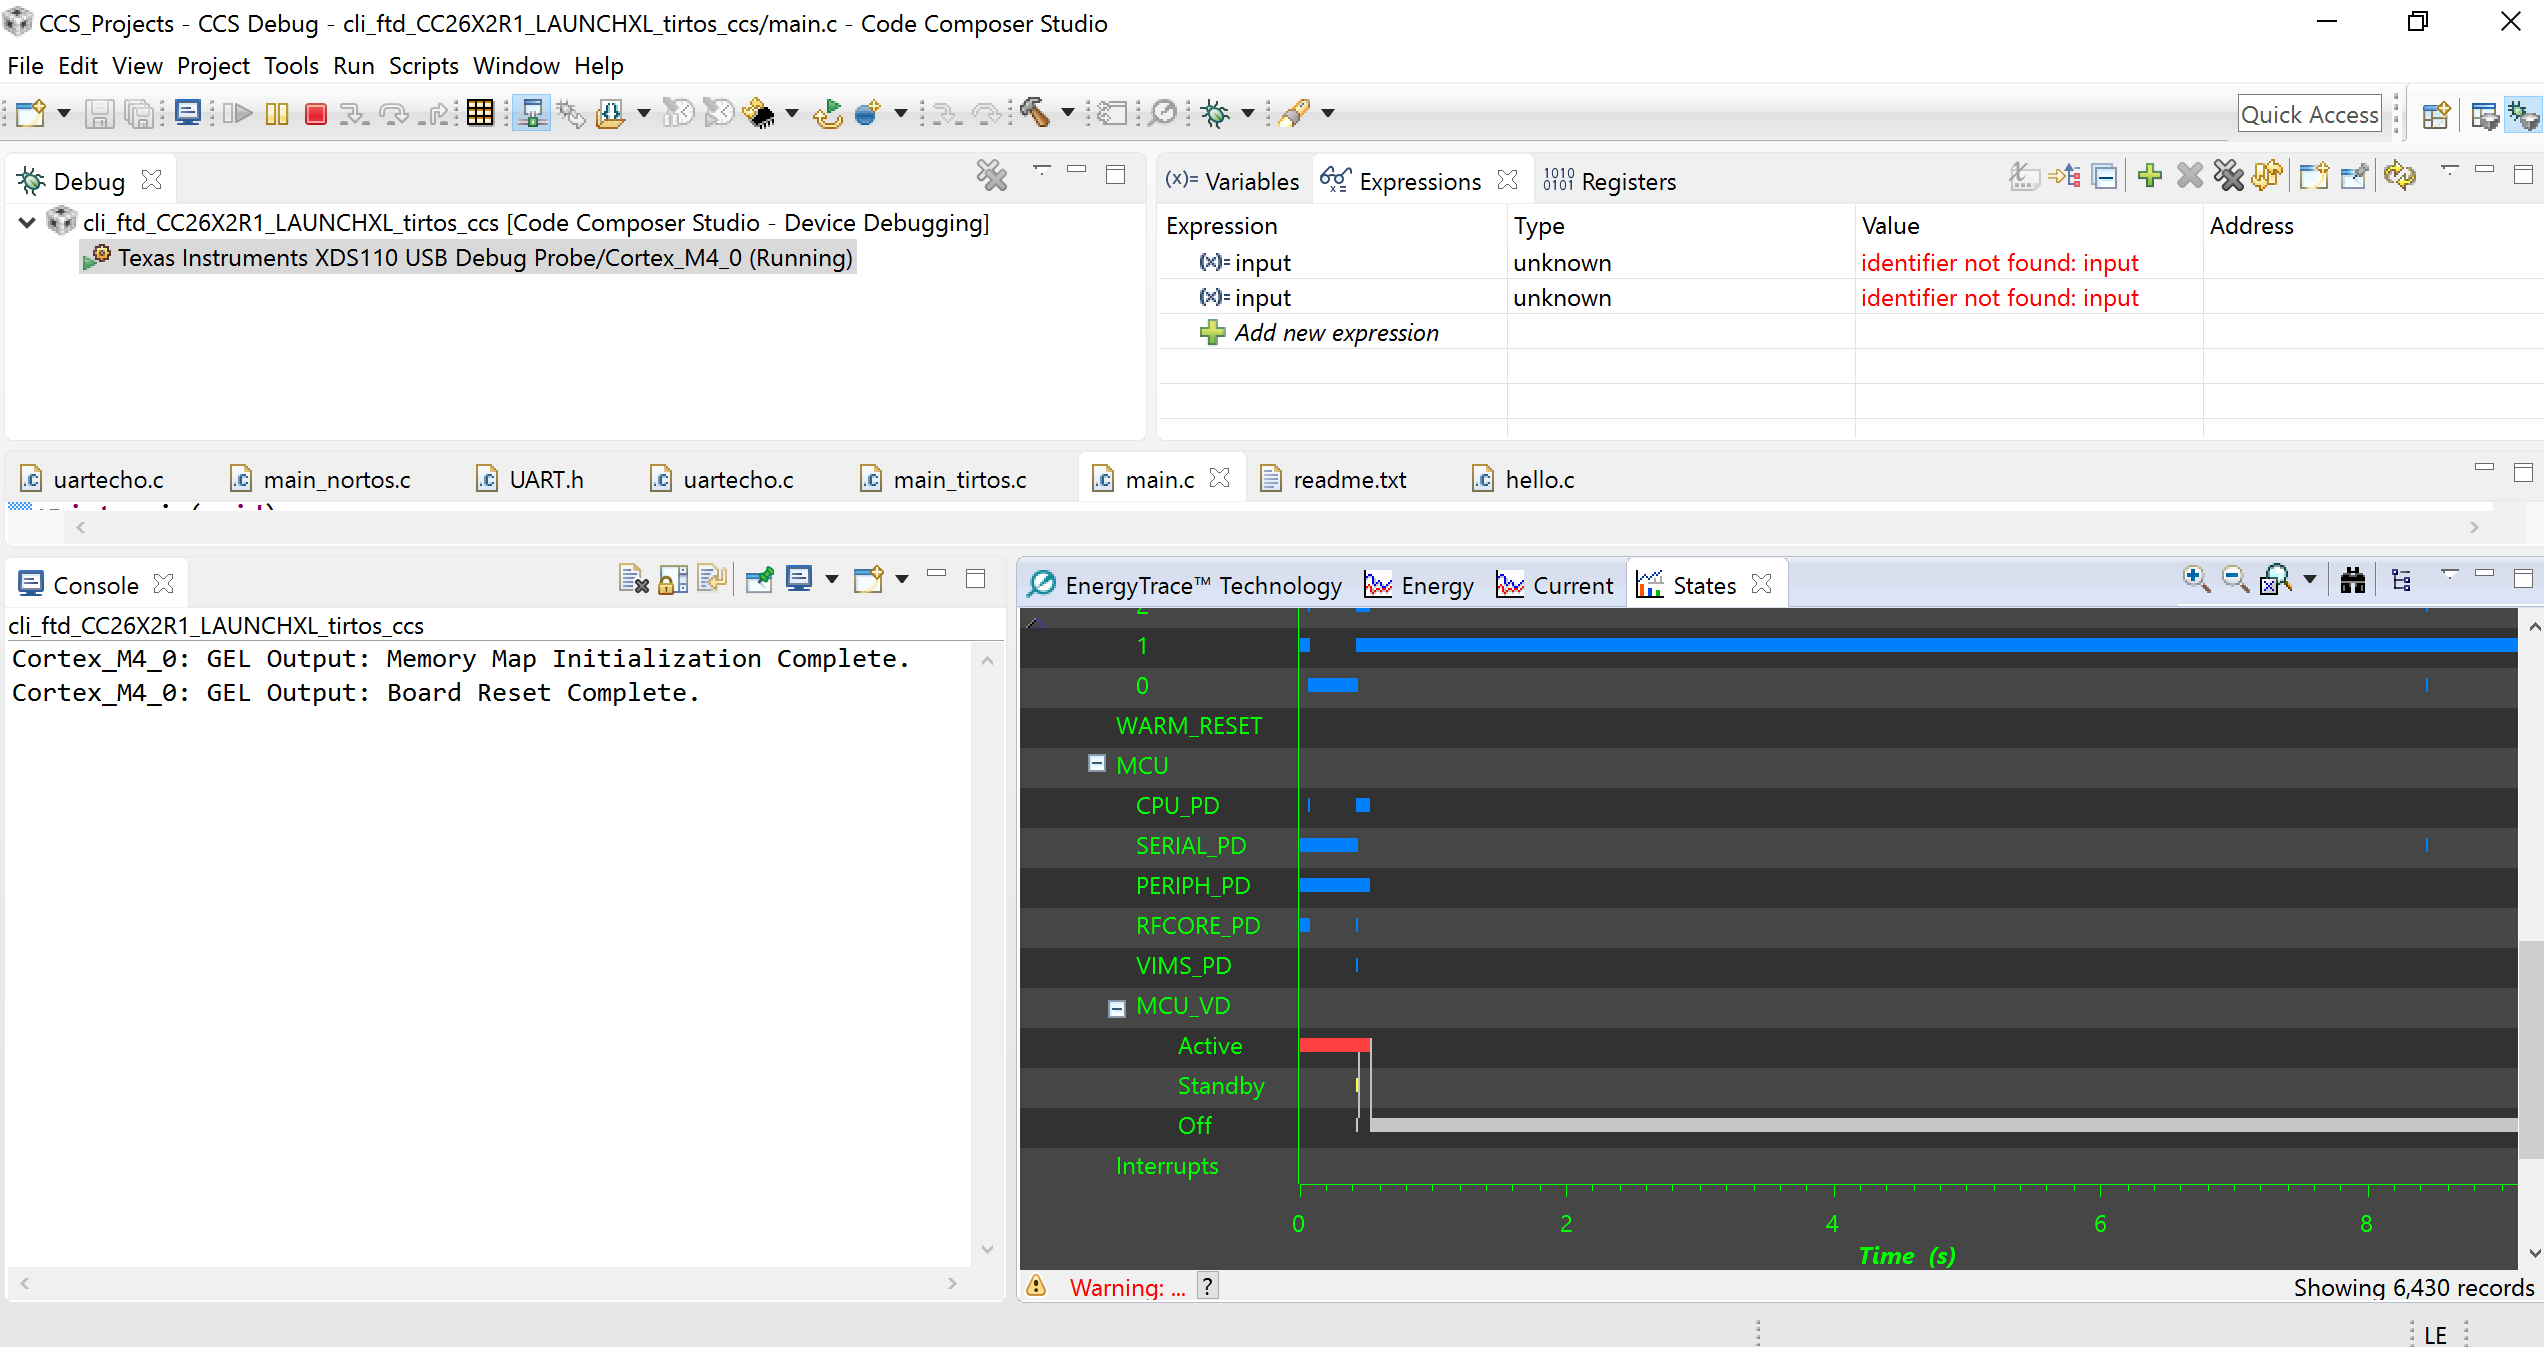
Figure 93. Sample EnergyTrace++ “States” Tab
Using EnergyTrace with an External Target
The power profile of an external target can be measured using EnergyTrace and a compatible debugger: an XDS110 ETHDR Debug Probe or a CC13x2 or CC26x2 LaunchPad Kit (the debug probe is embedded on the LaunchPad board). In this section, we will use a CC26x2R LaunchPad to measure the power profile of a CC2640R2F.
Before getting started, make sure the external target is already flashed with the application firmware to be tested.
The following steps are required to use EnergyTrace with an external target:
- Remove all the jumpers from the top row of both LaunchPads as shown in Figure 94..
- Use jumper wires to supply power to the CC2640R2F from the CC26x2R LaunchPad as shown below.
- At this point, connect only the CC26x2R LaunchPad to the PC via a USB cable. The external target will receive power from the CC26x2R LaunchPad.
- Follow the steps in EnergyTrace stand-alone Instructions to measure the power profile of the external target.
Tip
Ensure that only one CC26x2R LaunchPad is connected to the PC at a time to ensure the correct LaunchPad is automatically selected by EnergyTrace.
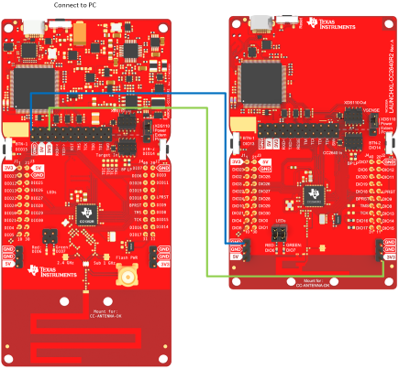
Figure 94. External Target Hardware Configuration
The above diagram shows the hardware setup required to use EnergyTrace to measure the power profile of the CC2640R2F.
Note
With the jumpers removed, a 10-pin JTAG cable can be connected to the external target for debugging purposes. If UART is required, jumper wires should be placed to connect the TX/RX lines of the external target to the CC26x2R LaunchPad.
Troubleshooting
If EnergyTrace is not able to properly setup remote controls for the device, try closing CCS, resetting your Evaluation Board and starting again.