Zephyr Project Debugging Guide#
Texas Instruments™
2 hours read
Introduction#
Welcome to this lab, which will teach you how to debug your Zephyr project. Make sure to pay attention to all of the required hardware and software and to follow the steps carefully to complete your setup.
Prerequisites#
For this lab, a host computer running Linux is needed, preferably Ubuntu as this is what this lab will use.
You should already have setup the Zephyr development environment for SimpleLink boards. If this is not already done, you can follow this Zephyr Project Setup training on SimpleLink Academy.
In order to flash a firmware onto the board, two options are possible :
XDS110 LaunchPad™ development kit debugger, which should include a USB-C to USB-A cable for connecting the XDS110 to a computer.
J-Link Debug Probe, from SEGGER. The J-Link Plus debug probe was used for development and testing, but other J-Link debug probes might work too.
Warning
Older versions of J-Link debug probes hardware are not supported because they do not support dormant mode handling. While version 12.0 is known to be working, version 10.1 is known to be not supported.
You will need a development board which is supported by Zephyr. Here is the list of all boards officially supported by Texas Instruments™ :
Warning
Other Texas Instruments™ boards are supported in Zephyr, but are
maintained by the Zephyr community instead of Texas Instruments™. While
we recommend using one of the boards mentioned above, you could also use one
of these boards, but your mileage may vary :
Task 1 : Debugging a Zephyr project with OpenOCD and VSCode#
We’ve seen how to build and flash the Blinky project onto our board. This writes the firmware onto the flash memory of the board, and instructs the board to reboot and use this firmware.
In this task, we will see how to debug a Zephyr project using OpenOCD and the TI Embedded Debug for VS Code extension on Visual Studio Code. Debugging is useful to find the reason for bugs in our software. Unlike flashing, it allows us to halt our firmware in the middle of it’s execution, read the memory, and to see the control flow of our firmware.
The TI Embedded Debug for VS Code extension allows us to use VSCode’s graphical interface to debug a Zephyr binary on a LaunchPad. If you do not already have Visual Studio Code installed on your computer, you can install it here. This extension uses OpenOCD as their debugging server, so a XDS110 LaunchPad™ development kit debugger is necessary.
The Zephyr project that we will use in this task as a reference is the Blinky
sample from Zephyr. You can build this sample by running
west build -p always -b {BOARD_IDENTIFIER} samples/basic/blinky.
The {BOARD_IDENTIFIER} should be replace by the identifier of your board. You
can find all possible board identifiers by running west boards.
Installing the TI Embedded Debug for VS Code extension and its dependencies#
The first step is to install TI Embedded Debug for VS Code extension on
Visual Studio Code. You can either install it by going on
VSCode’s marketplace web page for the extension,
or directly in VSCode by clicking the Extensions button, searching for
TI Embedded Debug for VS Code and clicking the Install button.
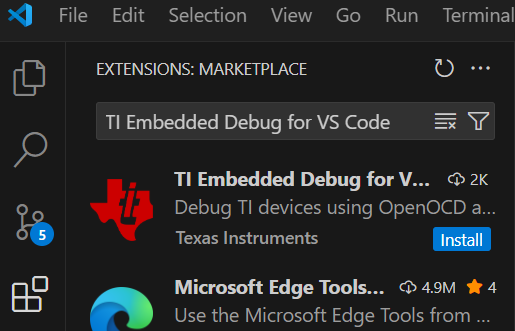
The TI Embedded Debug for VS Code in the Extension tab of VSCode#
Note
If you get a warning about trusting Texas Instruments™ for the VSCode extension, you should click the “Trust & Install” button.
Once the extension is installed, a new button with the logo of Texas Instruments™ should appear on VSCode’s Activity Bar on the left. When clicking on this button, the interface for the extension opens. You need to click the “Install Dependencies” button to install the dependencies necessary for the extension to work.
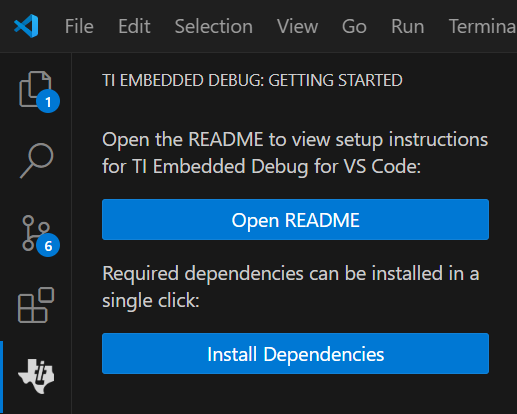
The TI Embedded Debug button in the Activity Bar of VSCode#
If the installation of the dependencies was successful, you should see a notification in the bottom right of VSCode saying that the dependencies have sucessfuly been installed.
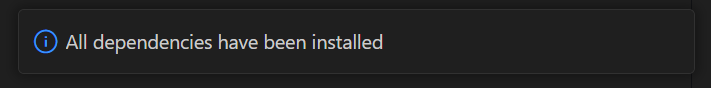
The notification received upon successful installation of the dependencies#
Finally, on Linux systems, you will need to run a script to install udev rules specific to TI devices. This script automatically gets downloaded as part of the dependency installation, but needs to be run manually due to requiring sudo priviledges. To run the script, you can open a terminal and run :
sudo ~/.config/Texas\ Instruments/ti-embedded-debug/ti-udev-rules/1.0.0/ti_permissions_install.sh --install
Setting up a debug launch configuration#
To start debugging a project, we need to create a debug launch configuration. This launch configuration will provide to OpenOCD with the settings used for the debugging session. These settings include for example :
The location of our ELF file generated in the build chapter of the previous Zephyr SimpleLink Academy training
The OpenOCD configuration file for our board
The logging level wanted for the VSCode extension and the OpenOCD server
To create a debug launch configuration in VSCode, you can click on
Run > Add Configuration... and selecting Cortex Debug.
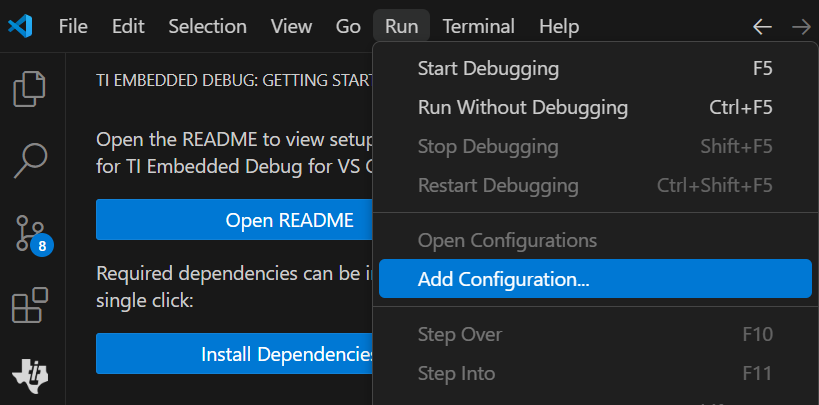
The Add Configuration... button in VSCode#
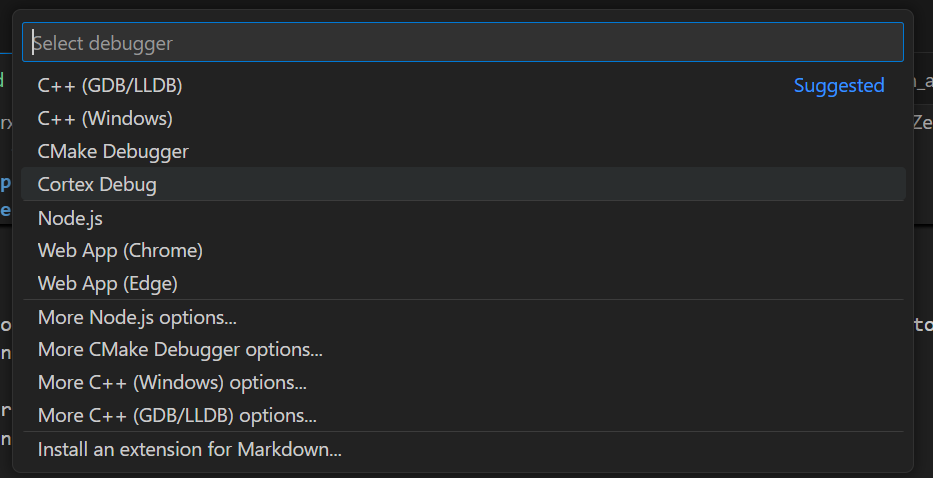
The Cortex Debug button in VSCode#
Clicking the Cortex Debug button will create a launch.json file in the
.vscode folder of your project, and automatically open it in VSCode.
By default your launch configuration will look like this :
{
    // Use IntelliSense to learn about possible attributes.
    // Hover to view descriptions of existing attributes.
    // For more information, visit: https://go.microsoft.com/fwlink/?linkid=830387
    "version": "0.2.0",
    "configurations": [
        {
            "name": "Cortex Debug",
            "cwd": "${workspaceFolder}",
            "executable": "./bin/executable.elf",
            "request": "launch",
            "type": "cortex-debug",
            "runToEntryPoint": "main",
            "servertype": "jlink"
        }
    ]
}
The example below shows what your launch configuration should look like for debugging a Zephyr project using the VSCode extension installed previously.
{
    "version": "0.2.0",
    "configurations": [
        {
            "name": "Zephyr TI Embedded Debug",
            "cwd": "${workspaceFolder}",
            "executable": "zephyr.elf",
            "request": "launch",
            "type": "cortex-debug",
            "servertype": "openocd",
            "searchDir": [
                "~/.config/Texas Instruments/ti-embedded-debug/openocd/<version>/share/openocd/scripts"
            ],
            "configFiles": [
                "./interface/xds110.cfg",
                "./board/<board_filename>.cfg"
            ],
            "runToEntryPoint": "main",
            "showDevDebugOutput": "none",
            "deviceName": "my-device"
        }
    ]
}
Some fields of this configuration have templates (<board_filename>,
<version>), and they should be replaced by their actual values. To find how
to replace these values later, we can refer to this table that explains of all
the configuration fields, so you can understand what to change :
Configuration field |
Explanation |
Example value / Possible values |
|---|---|---|
|
The name given for your debug configuration. Can be anything like the name of your project. |
|
|
Current Working Directory, all commands will be executed from this folder. This is only useful to allow for relative path instead of absolute path in other fields. |
|
|
The path to your ELF executable. If not using an absolute path, the path will be relative to the |
|
|
Whether the OpenOCD debugger should launch the ELF or attach to a running target. |
|
|
The type of the configuration. Only |
|
|
The type of the configuration. Only |
|
|
Array of path in which to search for the config files and scripts, which will be given to OpenOCD with the |
|
|
Array of path to the OpenOCD GDB Server configuration files to use when debugging. These files will be given to OpenOCD with the |
|
|
The debugger will run until it reaches that function and then halt. |
|
|
Used to debug the VSCode extension. |
|
|
Name of the SoC to debug. Any name is accepted |
|
For the rest of the guide, I will use the CC2340R53, so this is what my configuration file looks like :
{
  "version": "2.0.0",
  "configurations": [
    {
      "cwd": "/home/user1/zephyrproject/zephyr/build/zephyr",
      "executable": "zephyr.elf",
      "name": "Debug with TI Embedded Debug for VS Code",
      "request": "launch",
      "type": "cortex-debug",
      "servertype": "openocd",
      "searchDir": [
        "/home/user1/.config/Texas Instruments/ti-embedded-debug/openocd/20250225/share/openocd/scripts"
      ],
      "configFiles": [
        "./interface/xds110.cfg",
        "./board/ti_lp_em_cc2340r53.cfg"
      ],
      "runToEntryPoint": "main",
      "showDevDebugOutput": "none",
      "deviceName": "ti_lp_em_cc2340r53",
    }
  ]
}
Note
It is a known issue that the deviceName property will show up as
“not allowed” in launch.json, despite working fine. You can ignore this error.
Starting a debugging session#
Once your debug launch configuration file is complete, you can click Run >
Start Debugging, which will start the VSCode debugger configuration that we
just created. The extension will take care of flashing the device with the ELF
file that we gave in the debug launch configuration, attaching to the target
and stopping at the function we set in the runToEntryPoint.
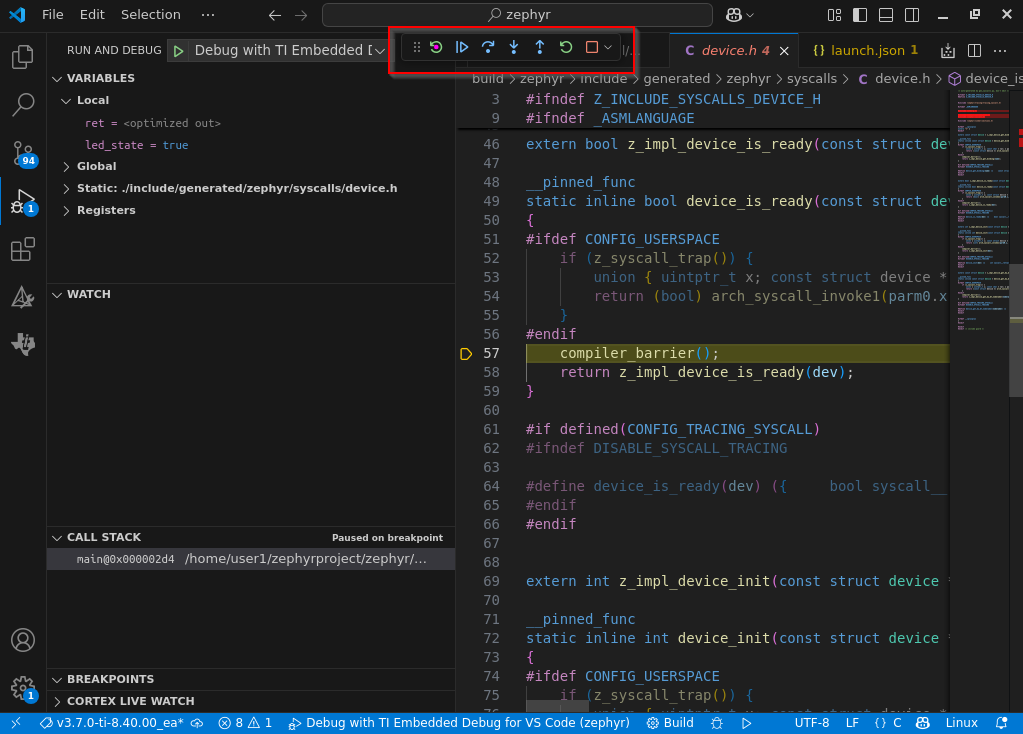
The VSCode debugging interface. In the red rectangle are the main debugging actions : Reset device, Continue, Step over, Step into, Step out, Restart and Stop#
Once you started the debugging session on the blinky project, you should be able to see the main debugging actions at the top, the local and global variables in the top left corner, the call stack and your breakpoints in the bottom left corner, and a lot of other useful data like the watched variables or the registers. You can also see the line that’s about to be executed in the next step highlighted in yellow.
Error
For SimpleLink SDK users only, Zephyr users are unaffected :
This debug method can be used for both .elf files that are generated by Zephyr
or by the SimpleLink SDK. If using the TIClang compiler with the SimpleLink
SDK, the resulting .elf file has a section called .TI.phattrs. On older
versions of the TIClang compiler, this .TI.phattrs section contains
values that are incompatible with OpenOCD. This issue results in OpenOCD
failing to disassemble the ELF, and the debug session to fail.
A workaround is to execute a command to remove the problematic values in
.TI.phattrs by adding a command in CCS’ post-build steps. You can find the
tiarmobjcopy executable under C:\ti\ti-cgt-arm_<TICLANG_VERSION>\bin.
tiarmobjcopy --set-section-type=.TI.phattrs=1 executable_file.out
This command changes the file in place. If you want to keep the old file and create a new one, you can instead use the following command :
tiarmobjcopy --set-section-type=.TI.phattrs=1 executable_file.out new.out
The final effect is that sh_type for the section .TI.phattrs changes from
SHT_TI_PHATTRS to SHT_PROGBITS.
Warning
“Wait ! My debugger did not stop in the function that I set in
runToEntryPoint ! What happened ?”
The ELF file that we are debugging has been compiled by the Zephyr toolchain, and has been optimized for performance and file size. The compiler can sometimes take the liberty to remove a line, optimize out functions and variables, or to directly inline a function. If the first instruction of your function (excluding variable declarations) is a function call, it’s possible that this function was inlined, and that this function call has been replaced by copying the body of the function into the original function.
This should not have a big impact on your debugging, and you can still step
out of the inlined function to return to the original function. If this
behavior is too distracting for your debugging, you can disable it by adding
CONFIG_NO_OPTIMIZATIONS=y to the prj.conf file of your project, which will
build all files with the -O0 flag.
Once we click the Step over button, we can see the main function of our project. From here we can set breakpoints by clicking on the red dot, on the right of the line number of your instruction, use the debugging actions to move around in the program, and observe its behavior.
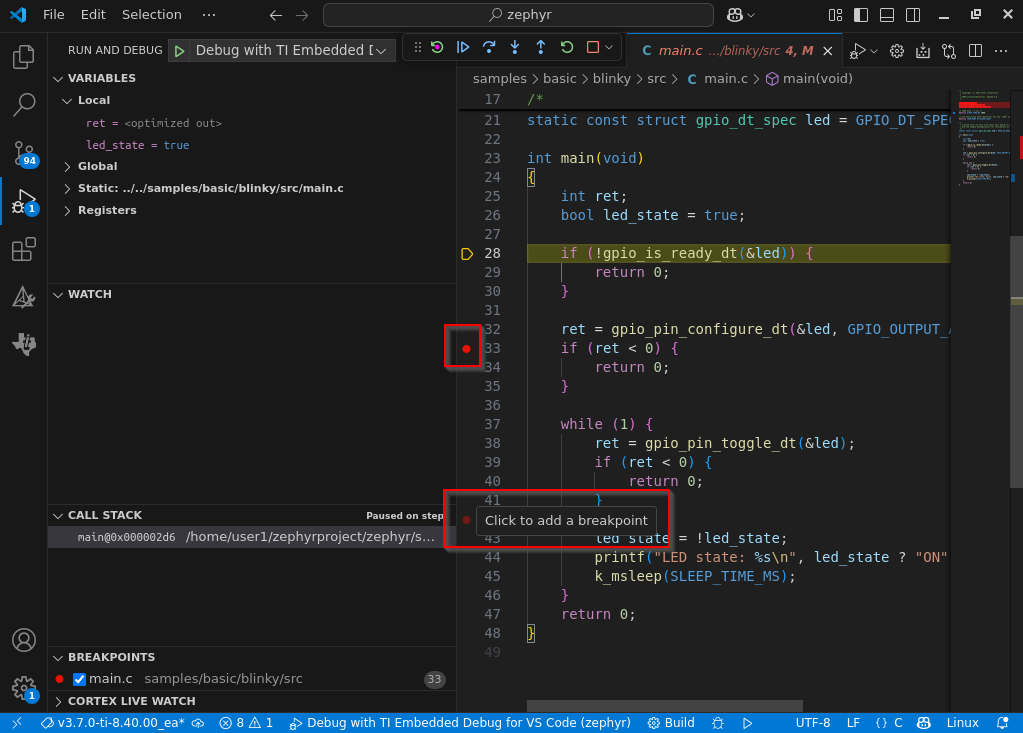
The VSCode debugging interface in the main function. In this example, I have setup a breakpoint on line 33, and I am currently adding a new breakpoint on line 42.#
Hint
You can now debug any Zephyr project that runs on a SimpleLink™ board, congratulations !
Task 2 : Add logging to a Zephyr project#
In this task, we will see how to add logging in a Zephyr project using Zephyr’s logging API. This allows us to easily have configurable logging levels in our project.
Outputting text through UART#
The first step of this task will be to read text sent by the firmware through
UART. Our default Blinky sample already sends text through UART thanks to the
printf instruction in the main loop. This function will print the LED state
every cycle of the loop. Now we are going to recieved this LED state in a
terminal in order to debug the state of our firmware.
We first need to find which device to open a serial connection with. On Linux,
the devices will always be referenced as an ACM device, and will always be
located under /dev/. To find all ACM devices connected to your PC, you can
unplug your board if it’s already plugged, plug it back, and then run the
command sudo dmesg | grep ttyACM, which will return all ACM devices detected
by Linux, ordered by time of detection. Since we just plugged our device, the
latest device detected should be ours.
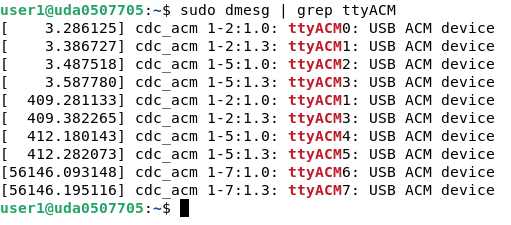
The output of the sudo dmesg | grep ttyACM command. In this screenshot,
our device is either /dev/ttyACM6 or /dev/ttyACM7.#
To open a serial connection with your board, most Linux distributions come
with the screen utility installed on them. This allows Linux to open a
serial connection with a device. You can open a terminal and use the following
command :
screen /dev/ttyACM0 115200
Note
Here, 115200 is the baud rate for the UART connection. 115200 is the
default baud rate for the CC234053. This value is defined in the devicetree
files for the board, that you can find in
zephyr/boards/ti/lp_em_cc2340r53/lp_em_cc2340r53.dts. We will talk more
about Zephyr devicetrees in the next training in SimpleLink Academy, which is about board porting on Zephyr.
Warning
Make sure to replace /dev/ttyACM0 with the actual device that we found
previously !
If nothing happens when running screen, you may have selected the wrong
device. Try to exit screen with Ctrl + a followed by k and then a y
to confirm. Then, you can open screen with another ACM device.
If everything went fine, you should be able to see the serial output in your terminal, which should look something like this :
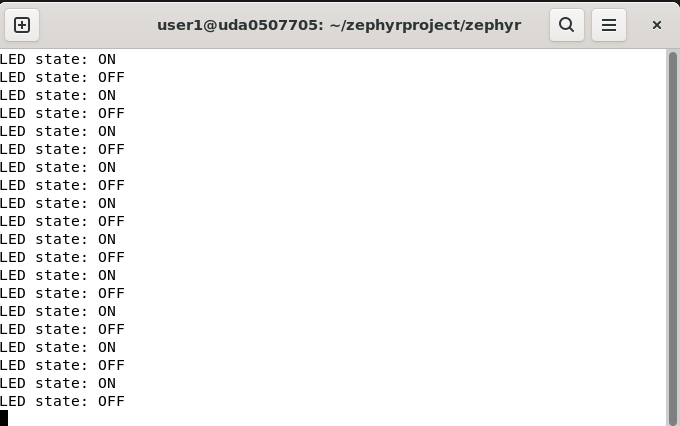
The serial output of the Blinky sample#
Adding our own logging module and reading the output#
While using printf for small projects is acceptable, as the project grows
in size, we will want to use Zephyr’s logging modules. Zephyr logging modules
bring multiple advantages compared to the regular printf :
First, these modules allow us to split logging into multiple modules, allowing us to disable them on a per-module basis. A logging module is declared for one entire source file, and one source file can only use one logging module.
Second, they bring a lot more information, including the time when the log happened, and the module in which the log happened. This means that we can have the same log text in multiple files, without worrying about recognizing which one was triggered.
Third, they are separated into multiple levels of logging. From the most detailed to the least detailed, the levels are ranging from Debug, Info, Warning, Error. This allows us for example to only listen for errors, and to only keep the important messages.
Fourth, the logging instructions that are unused are optimized away automatically, saving flash size. For example, if we only listen to warnings and above, then debug and info logging instructions will not be optimized out and not be compiled.
Finally, by splitting logging into different modules and different levels, we can ask Zephyr to enable only the logging of one single module at one single level, allowing for more granularity. If we happen to have a bug in the Bluetooth advertisement functions, we could simply enable logging for the Bluetooth advertisement module and to only listen for errors. This also allows us to easily share our code to other users, without flooding their serial output with logs they don’t need.
Now that you are convinced that Zephyr logging modules are great, we will show how to implement them in our code. The main steps are to register a module, and then to use the logging functions.
To register a module, you need to include Zephyr’s header file for logging, and to call the LOG_MODULE_REGISTER macro.
#include <zephyr/logging/log.h>
LOG_MODULE_REGISTER(blinky, LOG_LEVEL_INF);
This code will create the logging module called blinky for the entire file,
and will log all messages with a log level above or equal to Info,
skipping out logging instruction with a logging level of Debug.
Warning
We can only register a logging module once ! If we wish to use the blinky
logging module in another file, you must use the
LOG_MODULE_DECLARE
instead.
Then, we can use the logging functions to log our messages. Zephyr provides one logging function for each log level :
Finally, our Blinky sample will look like this once we use the logging modules :
#include <stdio.h>
#include <zephyr/kernel.h>
#include <zephyr/drivers/gpio.h>
#include <zephyr/logging/log.h>

LOG_MODULE_REGISTER(blinky, LOG_LEVEL_INF);

/* 1000 msec = 1 sec */
#define SLEEP_TIME_MS 1000

/* The devicetree node identifier for the "led0" alias. */
#define LED0_NODE DT_ALIAS(led0)

/*
 * A build error on this line means your board is unsupported.
 * See the sample documentation for information on how to fix this.
 */
static const struct gpio_dt_spec led = GPIO_DT_SPEC_GET(LED0_NODE, gpios);

int main(void)
{
	int ret;
	bool led_state = true;

	if (!gpio_is_ready_dt(&led)) {
                LOG_ERR("LED GPIO is not ready.");
		return 0;
	}

	ret = gpio_pin_configure_dt(&led, GPIO_OUTPUT_ACTIVE);
	if (ret < 0) {
                LOG_ERR("LED GPIO configuration failed.");
		return 0;
	}

	while (1) {
		ret = gpio_pin_toggle_dt(&led);
		if (ret < 0) {
                        LOG_ERR("LED GPIO toggle failed.");
			return 0;
		}

		LOG_INF("LED Blinked!");

		led_state = !led_state;
		LOG_DBG("LED state: %s", led_state ? "ON" : "OFF");
		k_msleep(SLEEP_TIME_MS);
	}
	return 0;
}
If we build this sample and look at the serial output, we should have something similar to this :
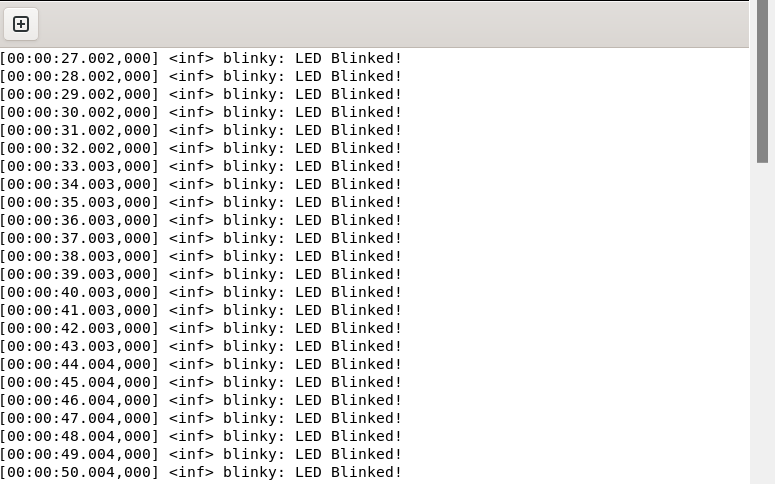
The serial output of the Blinky sample when using LOG_LEVEL_INF as the logging level#
You may have noticed that the text inside the LOG_DBG instruction in our
loop is never displayed. This is because the logging level we have set for our
blinky logging module is LOG_LEVEL_INF. This means that any logging
instruction with a logging level inferior to Info, such as Debug, have
been optimized out and removed by the compiler. If we want to have the
Debug logging level for our logging module, we can set the logging level
to LOG_LEVEL_DBG.
Making the logging module configurable#
Having to change the logging level macro for our module manually in the source
code every time we want a different logging level is quite the repetitive and
annoying task. To avoid this problem, we will create a Kconfig file to add
more config options to our sample. Create a file called Kconfig at the root
of the Blinky sample (it should be at the same level as the prj.conf
file), and add this to the file :
choice "BLINKY_LOG_LEVEL_CHOICE"
	prompt "Max compiled-in log level for Blinky"
	default BLINKY_LOG_LEVEL_DEFAULT
	depends on LOG

config BLINKY_LOG_LEVEL_OFF
	bool "Off"

config BLINKY_LOG_LEVEL_ERR
	bool "Error"

config BLINKY_LOG_LEVEL_WRN
	bool "Warning"

config BLINKY_LOG_LEVEL_INF
	bool "Info"

config BLINKY_LOG_LEVEL_DBG
	bool "Debug"

config BLINKY_LOG_LEVEL_DEFAULT
	bool "Default"

endchoice

config BLINKY_LOG_LEVEL
	int
	depends on LOG
	default 0 if BLINKY_LOG_LEVEL_OFF
	default 1 if BLINKY_LOG_LEVEL_ERR
	default 2 if BLINKY_LOG_LEVEL_WRN
	default 3 if BLINKY_LOG_LEVEL_INF
	default 4 if BLINKY_LOG_LEVEL_DBG
	default LOG_DEFAULT_LEVEL if BLINKY_LOG_LEVEL_DEFAULT

source "Kconfig.zephyr"
Note
Some readers will recognize the syntax of the Kconfig files for the Linux kernel
This Kconfig file creates 7 new config options that we can select from our
prj.conf file. The BLINKY_LOG_LEVEL will act as a variable that can either
be set manually or be set indirectly by selecting one of the 6 other configs.
For example, if we want to set BLINKY_LOG_LEVEL to debug, we can add the
following lines to our prj.conf file :
CONFIG_LOG=y
CONFIG_BLINKY_LOG_LEVEL_DBG=y
Finally, we will change logging module that we registered in the main.c file
of our blinky project, to make it use our new config variable. We can change
the log level in our Blinky sample code from this :
#include <zephyr/logging/log.h>

LOG_MODULE_REGISTER(blinky, LOG_LEVEL_INF);
To this :
#include <zephyr/logging/log.h>

LOG_MODULE_REGISTER(blinky, CONFIG_BLINKY_LOG_LEVEL);
If we build and flash the blinky sample with this new code, we should have the logging level for the blinky module set to Debug, which should look like this :
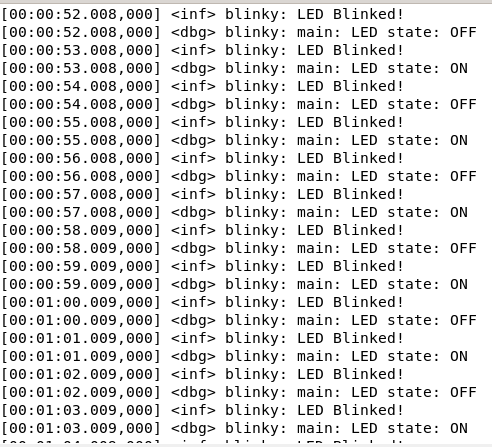
The serial output of the Blinky sample when using CONFIG_BLINKY_LOG_LEVEL_DBG#
Enabling Zephyr’s logging for other modules#
We have seen how to use the logging module for our own code, but now we want to change this logging module for other modules. We will use the logging module for the Bluetooth drivers in this example.
The logging system for the drivers and other parts of Zephyr all use a logging
module similar to what we created for our Blinky sample. This means that we
simply have to set the right config boolean in the prj.conf of our sample to
enable logging with the specified module. For example, if we want to enable
the logging for the Bluetooth module in Zephyr’s Bluetooth central sample,
located under zephyr/samples/bluetooth/central, we can add the following
lines to zephyr/samples/bluetooth/central/prj.conf :
CONFIG_LOG=y
CONFIG_BT_LOG_LEVEL_DBG=y
Finally, we can build the bluetooth central sample using
west build -p always -b {BOARD_IDENTIFIER} samples/bluetooth/central, flash
it using UniFlash or west flash, and connect a serial terminal like we did
for the Blinky sample.
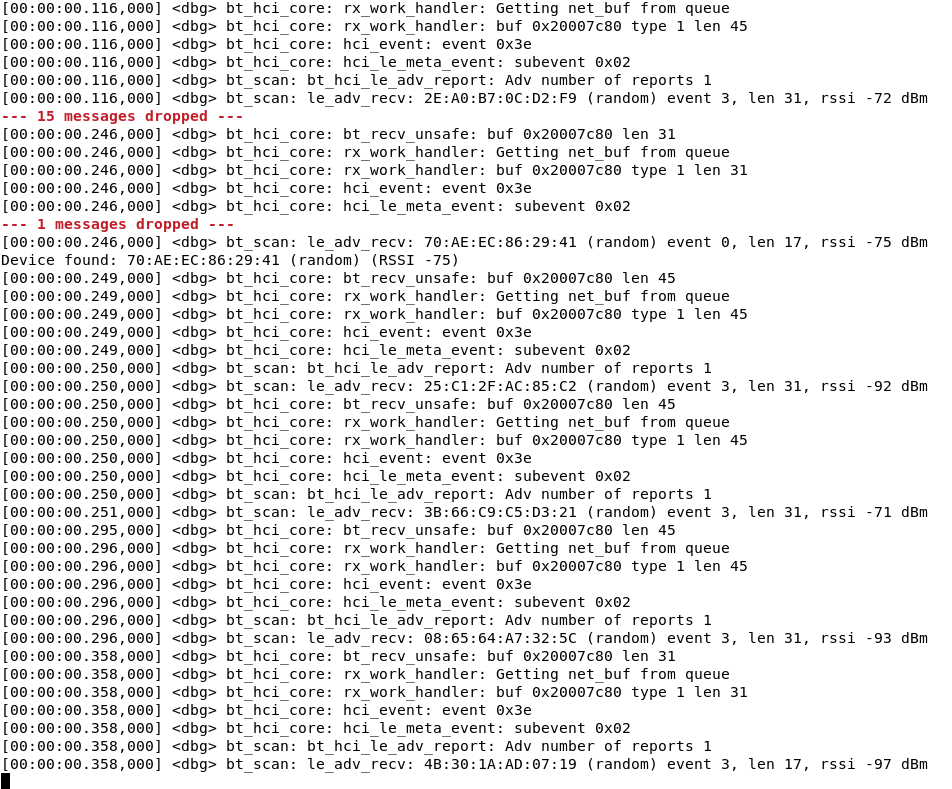
The serial output of the central sample with the CONFIG_BT_LOG_LEVEL_DBG option#
If you’re able to see the debug information for the Bluetooth Zephyr drivers, then congratulations, you successfully enabled logging in your project !
Warning
In the previous example, this training generously gave you the right configuration setting to enable for Bluetooth. If you want to look up the right configuration you need to enable, you can search using Zephyr’s Kconfig Search. This page allows you to search for every Kconfig configuration you might need.
To search for logging module configuration specifically, you can search for
something like LOG <keyword>, which will give you all logging configurations
related to logging and your keyword. For example, searching LOG Bluetooth
returns 35 different logging options, ranging from Bluetooth Attribute
Protocol to Bluetooth Resolvable Private Address. This page is also useful for
other configurations than logging, and I recommend you to bookmark it if you
plan to work with Zephyr.
Task 3 : Debugging TX/RX output with the PA/LNA pins#
In this task, we will see how to set the Power Amplification (PA) and Low Noise Amplification (LNA) pins. The RF output of our board can be mapped to pins on the LaunchPad for RF signal debugging. These pins are intended to be used when connecting an RF range extender. However, they can also help in instances where it is unclear if the device is transmitting or receiving in the right window. The Power Amplification pin will be high when the device is transmitting (TX), and the Low Noise Amplification pin will be high when the device is receiving (RX). This allows us to easily see if our radio is currently transmitting or receiving data.
Adding the PA/LNA code#
While the code to enable the PA and LNA pins is not yet implemented in our
drivers, we can work around this by implementing it ourselves manually. We will
use Zephyr’s peripheral sample, that can be found under
zephyr/samples/bluetooth/peripheral. We want to make sure that we are
sending advertisement packets using the radio, but also listening for scan
requests that we can reply to.
In the main.c file of the peripheral sample, we can add the following C
code :
#include <ti/devices/DeviceFamily.h>
#include DeviceFamily_constructPath(inc/hw_types.h)
#include DeviceFamily_constructPath(inc/hw_memmap.h)

#include <zephyr/dt-bindings/pinctrl/cc23x0-pinctrl.h>
#include <zephyr/drivers/pinctrl.h>
#include <zephyr/drivers/gpio.h>
#include <driverlib/lrfd.h>


#define IOC_BASE_PIN_REG 0x00000100
#define IOC_ADDR(index)  (IOC_BASE + IOC_BASE_PIN_REG + (sizeof(uint32_t) * (index)))

void RCL_GPIO_enable()
{

    /* RFEGPO0 */
    HWREG_WRITE_LRF(LRFDDBELL_BASE + LRFDDBELL_O_GPOSEL0) = HWREG_READ_LRF(LRFDDBELL_BASE + LRFDDBELL_O_GPOSEL0) | (LRFDDBELL_GPOSEL0_SRC1_RFEGPO0);

    /* RFEGPO1 */
    HWREG_WRITE_LRF(LRFDDBELL_BASE + LRFDDBELL_O_GPOSEL0) = HWREG_READ_LRF(LRFDDBELL_BASE + LRFDDBELL_O_GPOSEL0) | (LRFDDBELL_GPOSEL0_SRC0_RFEGPO1);

    const pinctrl_soc_pin_t pins[2] = {
        {
            .pin = 11,
            .iofunc = DIO11_LRFD0,
            .iomode = 0 // Output
        },
        {
            .pin = 21,
            .iofunc = DIO21_LRFD1,
            .iomode = 0 // Output
        }
    };

    pinctrl_configure_pins(
        pins,
        2,
        0 // Unused
    );
}
What the function does is enabling the PA and LNA output by writing to a LRF
register, and sets the source for those pins to SRC1 for RFEGPO0 and
SRC0 for RFEGPO1. The pins associated with LRFD0 are 3 and 11, and that
the pins associated with LRFD1 are 4 and 21. Since pin 3 and pin 4 are already
used for LGPT0, we chose to use pin 11 and 21.
We then set the pinmux of pin 11 and 21 to LRFD, and configure them as outputs.
The next thing we need to do is to call the RCL_GPIO_enable function in
main :
RCL_GPIO_enable function from main#int main(void)
{
RCL_GPIO_enable();
struct bt_gatt_attr *vnd_ind_attr;
char str[BT_UUID_STR_LEN];
int err;
...
}
We can finally build the project as usual by using west build -p always -b {BOARD_IDENTIFIER} samples/bluetooth/peripheral, and flash it using UniFlash or west flash.
Verifying the output of the PA/LNA pins#
With a logic analyzer, we can check the value of pins 11 and 21. We should have something similar to this :
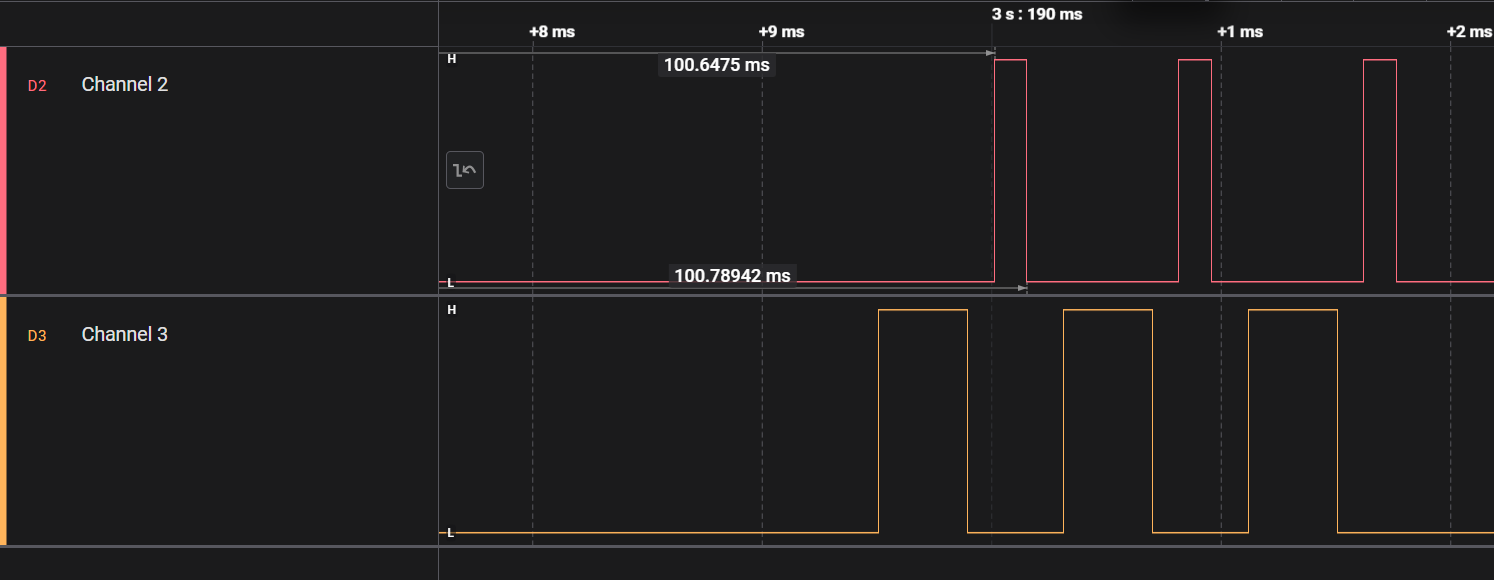
Output from a logic analyzer of the pins 11 in red and 21 in orange.#
In this screenshot we can see in red the pin 11, which is the PA pin, and in orange the pin 21, which is the LNA pin. What we can observe is similar to what we would expect from a scannable advertising peripheral, which alternates between listening for scan requests and sending advertisement packets on the 3 BLE advertisement channels.
Hint
You can now build and flash Zephyr project, debug through your code, read logs from the different Zephyr modules and verify if your radio is transmitting or receiving. Congratulations ! The next step is to explore the Zephyr API to see all the possibilities offered by this RTOS, and then to port Zephyr on your own custom board with the Zephyr Project Board Porting guide on SimpleLink Academy. You can also explore how to measure the energy consumption of your firmare using Energy Trace