Debugging
Debug Interfaces
The CC23xx platform supports SWD interfaces. Debug probe that support SWD like the TI XDS110 can work natively with the CC23xx. The hardware resources included on the devices for debugging are listed as follows. Not all debugging functionality is available in all combinations of debug probe and IDE.
Flash Patch and Breakpoint Unit (FPB) - 6 instruction comparators, 2 literal comparators
Data Watchpoint and Trace Unit (DWT) - 5 watchpoints on memory access
Instrumentation Trace Macrocell (ITM) - 32 x 32 bit stimulus registers
Trace Port Interface Unit (TPIU) - serialization and time-stamping of DWT and ITM events
XDS110 Debug Probe
The CC23xx LaunchPad support a 20-pin LP-EM debug connector, and the XDS110ET LaunchPad is the assumed debug probe for most development.
The XDS110 is the latest entry level debug probe (emulators) for TI embedded processors. Designed to be a complete solution that delivers JTAG and SWD connectivity at a low cost, the XDS110 is the debug probe of choice for entry-level debugging of TI microcontrollers, processors and SimpleLink devices. Also, both Core Processor and System Trace are available for all Arm and DSP devices that support Embedded Trace Buffer (ETB).
It is also possible to buy the XDS110 JTAG Debug Probe or use the XDS110 existing on-board another SimpleLink LaunchPad.
Configuring Debugger in Code Composer Studio
If only one debug probe is attached, CCS will automatically select the
connected debug probe when a debug session is started. You can start a debug
session by clicking the debug icon ![]() on the toolbar.
on the toolbar.
If more than one debug probe is attached when a debug session is started, CCS will prompt you to select a debug probe as seen in Figure 78. CCS will save the selected debug probe in the target configuration for the project.
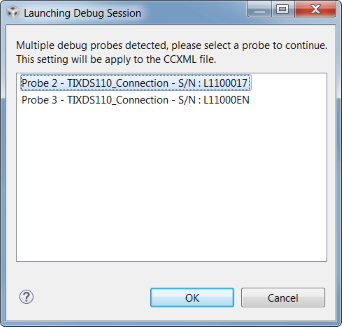
Figure 78. CCS Probe Selection
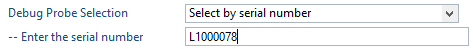
To set or change the selected debug probe for a project, it is necessary to set the serial number for the probe in the project’s target configuration.
Find The Serial Number
To find the serial number for XDS110 debug probe, open a command prompt and run
the xdsdfu.exe command for your CCS version, e.g.
<CCS_INSTALL_DIR>\ccs\ccs_base\common\uscif\xds110\xdsdfu.exe -e.
This will enumerate all the attached XDS110 debug probes. This should result in
output like the following.
C:\>c:\ti\ccs1210\ccs\ccs_base\common\uscif\xds110\xdsdfu.exe -e

USB Device Firmware Upgrade Utility
Copyright (c) 2008-2019 Texas Instruments Incorporated.  All rights reserved.

Scanning USB buses for supported XDS110 devices...


<<<< Device 0 >>>>

VID: 0x0451    PID: 0xbef3
Device Name:   XDS110 Embed with CMSIS-DAP
Version:       3.0.0.22
Manufacturer:  Texas Instruments
Serial Num:    LS420073
Mode:          Runtime
Configuration: Standard

Found 1 devices.

C:\>
Configure Serial Number
It may be necessary to set or unset the selected debug probe. Use the following steps to do this.
|
|
|
|
|
|
|
|
It can be done also by open a command prompt and run
the xdsdfu.exe command for your CCS version, e.g.
<CCS_INSTALL_DIR>\ccs\ccs_base\common\uscif\xds110\xdsdfu.exe -m<CCS_INSTALL_DIR>\ccs\ccs_base\common\uscif\xds110\xdsdfu.exe -s LS47XXXX -r
These will first switch XDS110 to DFU mode if it is already in runtime mode, then set the serial number to the LS47XXXX. The output should be like the following.
C:\>c:\ti\ccs1210\ccs\ccs_base\common\uscif\xds110\xdsdfu.exe -m

USB Device Firmware Upgrade Utility
Copyright (c) 2008-2019 Texas Instruments Incorporated.  All rights reserved.

Scanning USB buses for supported XDS110 devices...


<<<< Device 0 >>>>

VID: 0x0451    PID: 0xbef3
Device Name:   XDS110 Embed with CMSIS-DAP
Version:       3.0.0.22
Manufacturer:  Texas Instruments
Serial Num:    L1100JU9
Mode:          Runtime
Configuration: Standard

Switching device into DFU mode.

C:\>c:\ti\ccs1210\ccs\ccs_base\common\uscif\xds110\xdsdfu.exe -s LS47XXXX -r

USB Device Firmware Upgrade Utility
Copyright (c) 2008-2019 Texas Instruments Incorporated.  All rights reserved.

Scanning USB buses for supported XDS110 devices...

Setting serial number to "LS47XXXX"...

C:\>
Note
More information of the tool can be found in
<CCS_INSTALL_DIR>\ccs\ccs_base\common\uscif\xds110\XDS110SupportReadMe.pdf
For XDS100 series debug probes, open a command prompt and run the
xds100serial.exe command for your CCS version, e.g.
<CCS_INSTALL_DIR>\ccs\ccs_base\common\uscif\xds100serial.exe. This should result
in output like the following:
C:\>c:\ti\ccs1210\ccs\ccs_base\common\uscif\xds100serial.exe
Scanning for XDS100 emulators...

VID/PID    Type            Serial #    Description
0403/a6d1  XDS100v3        06EB12213144  Texas Instruments XDS100v3

C:\>
Getting started with CCS debug interface
This section describes the debug interface offered by CCS. More extensive documentation is provided in the CCS Debug Environment Guide.
Start a debug session
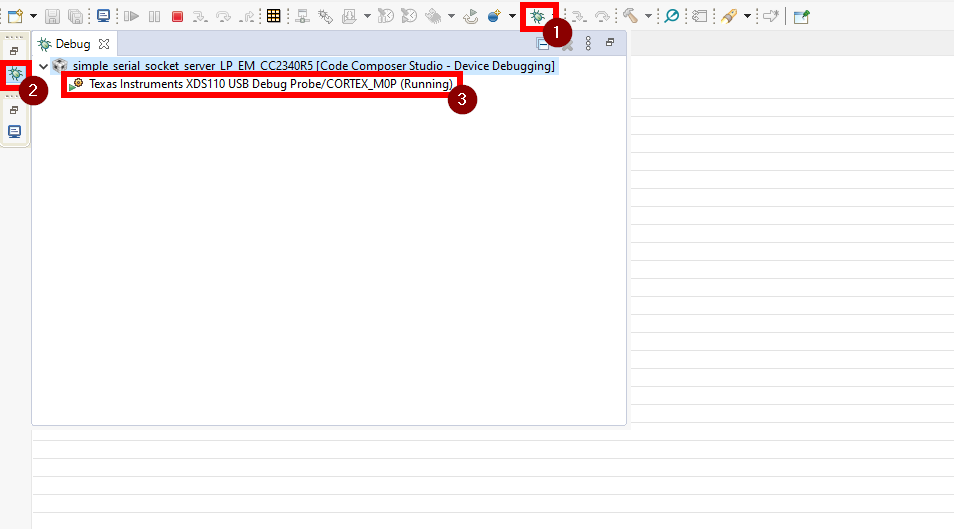
To start a debug session, click on the debug icon. If enabled to do and required, this will trigger a software build. It will also automatically download the binary on the CC23xx device.
Note
The small arrow next to the debug button offers the possibility to modify the Debug Configurations.
If needed, make sure to select the proper process in the Debug View.
Reset the device while debugging
TI recommends to use the default reset command (i.e. click on the
![]() button or use the shortcut
button or use the shortcut Ctrl+Shift+R).
Using other reset commands may lead to unexpected device behavior.
Breakpoints
Comparators in the Flash Patch and Breakpoint Unit (FPB) of the CC23xx LaunchPad are used to break on an instruction fetch. This can be used to patch a function as it is fetched from instruction memory. Or these comparators can be used to supply a Breakpoint (BKPT) instruction to the CPU. These instructions halt the processors operation, waiting for the debug probe.
Considerations
While breakpoints are a useful tool for debugging code online, they have the possibility of altering the execution flow of a piece of code.
Breakpoints and Timing
Synchronous RF protocols are timing sensitive. Breakpoints can easily halt the execution long enough to lose network timing and break the link.
To still be able to debug, place breakpoints as close as possible to where the relevant debug information can be read or step through the relevant code segment to debug.
After you hit a breakpoint and read out the necessary debug information, it is recommended that you reset the device and re-establish the connection.
Breakpoints and Optimization
When compiler optimizations are enabled, toggling a breakpoint on a line of C code may not result in the expected behavior. Some examples include the following.
Code is removed or not compiled in
Toggling a breakpoint in the IDE results in a breakpoint somewhere other than the intended line. Some IDEs disable breakpoints on nonexistent code.
Code block is part of a common subexpression
A breakpoint might be trigged from a function or piece of code near the marked line. This might have been due to the compiler reusing sections.
An if clause is represented by a conditional branch in assembly
A breakpoint inside an if clause always breaks on the conditional statement, even when the condition is not true.
TI recommends selecting an optimization level as low as possible when debugging. See Optimizations for information on modifying optimization levels.
Note
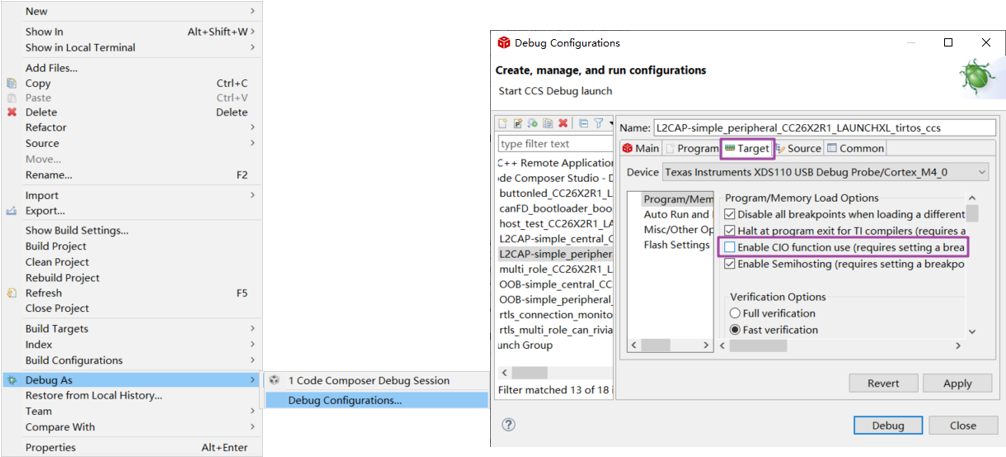
Due to limitation of Cotex-CM0+, the number of breakpoints for CC23xx devices is 4. Check breakpoints limitation of ARM Cortex-CM0+. During programming stage, debugger will use 3. Breakpoints set by application will be ignored if more than one breakpoint is used by the application. It is possible to gain one more breakpoint back by implementing the following steps. Right click on the project, go to Debug As->Debug Configuration->Target, unchecked ‘Enable CIO function use’.
Breakpoints in CCS
Note
CCS reserves one hardware breakpoint for instruction stepping.
To toggle a breakpoint, do any of the following.
Double-click the area to the left of the line number.
Press
Ctrl+Shift+B.Right-click on the line.
A breakpoint set on line 207 looks like the following.
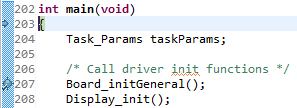
Figure 79. Breakpoint on line 207. Debugger halted at start of main().
For an overview of the active and inactive breakpoints, click on View
→ Breakpoints.
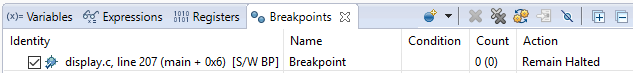
Figure 80. List of breakpoints. Right-click to edit options, or de-select to deactivate.
To set a conditional break, do as follows.
Right-click the breakpoint in the overview.
Choose Properties.
When debugging, Skip Count and Condition can help skip a number of breaks or only break if a variable is a certain value.
Note
Conditional breaks require a debugger response and may halt the processor long enough to break an active RF connection, or otherwise disrupt timing on the debug target.
Watching Variables and Registers
Debuggers offer several ways of viewing the state of a halted program. Global variables are statically placed during link-time and can end up anywhere in the RAM or Flash of the chip. These variables can be viewed when then target is halted by the debugger through the Watch and Expression windows.
Unless removed due to optimizations, global variables are always available in these views. Local variables or variables that are only valid inside a limited scope are only viewable in that scope. Such variables can also be viewed with the Watch or Expression views, and may also be automatically displayed when breaking or stepping through code.
Considerations
Local variables are often placed in CPU registers and not on the stack. These variables also have a limited lifetime even within the scope in which they are valid. Depending on the optimization performed, a variable placed in a register may not have a cohesive view of the current state of the variable. Some possible solutions are:
Move the variable to global scope, so it remains accessible in RAM.
Make the variable volatile, so the compiler doesn’t place the value in a register.
Make a shadow copy of the variable that is global and volatile.
Variables in CCS
You can view Global Variables by doing either of the following.
Select
View→Expressions.Select a variable name in code.
Right-click and select Add Watch Expression.
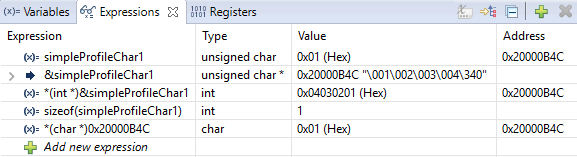
Figure 81. Variable watch window. Note that you can cast values, get address and sizeof, etc.
Select
View→Variablestoauto-variablesthat are present at the current location when stepping through code.
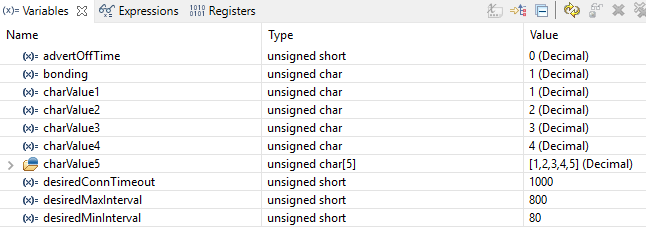
Figure 82. Local variables. This screenshot is taken during execution of an application function.
Memory Watchpoints
As mentioned in Debug Interfaces, the Data Watchpoint and Trace Unit (DWT module) contains four memory watchpoints that allow breakpoints on memory access. The hardware match functionality looks only at the address. If intended for use on a variable, the variable must be statically allocated.
Note
If a data watchpoint with value match is used, two of the four watchpoints are used.
Watchpoints in CCS
Right-click on a global variable.
Select
Breakpoint→Hardware Watchpoint.Go to the list of breakpoints (
View→Breakpoints).Right-click and edit the Breakpoint Properties to configure the watchpoint.
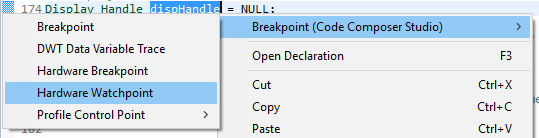
Figure 83. Adding a watchpoint on a variable.
This example configuration ensures that if 0x42 is written to the memory location for Characteristic 1 in the Bluetooth Low Energy basic_ble example project the device halts execution.
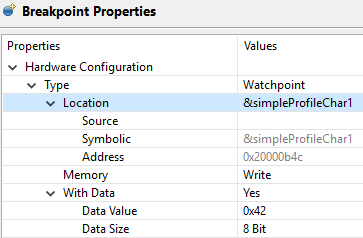
Figure 84. Configuring a hardware watchpoint to break on 8-bit write with value 0x42.
Runtime Object Viewer
Debuggers may include the Runtime Object Viewer (ROV) plug-in that provides insight into the current state of FreeRTOS, including task states, stacks, and so forth.
This section discusses some ROV views useful for debugging and profiling.
Viewing the State of Each Task
The Task Detailed view is useful for seeing the state of each task and its
related runtime stack usage. This picture below shows the state the first time the
user-thread is called.
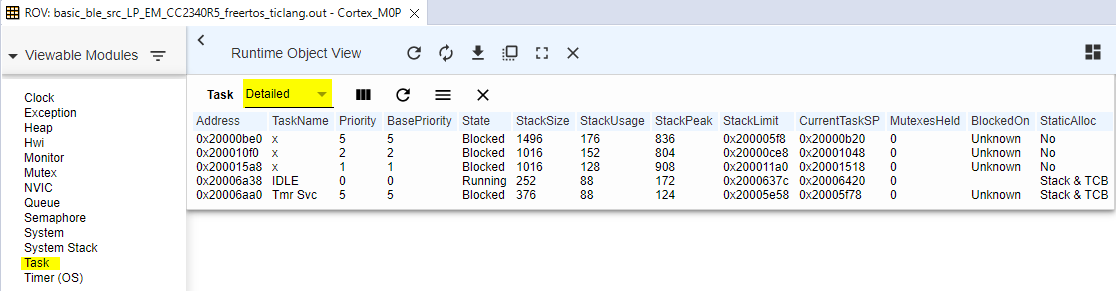
Figure 85. ROV Task Detail View
The following table explains the column in ROV Task Detail View
Address |
The memory location of the |
TaskName |
The name of the entry function of the task. |
Priority |
The RTOS priority for the task. |
State |
Current state of the task. |
StackSize |
The size of the runtime stack, configured when instantiating a task. |
StackPeak |
The maximum run-time stack memory used based on watermark in RAM, where the stacks are prefilled with 0xBE and there is a sentinel word at the end of the run-time stack. |
StackLimit |
The logical top of the runtime stack of the task. |
Note
Function calls may push the stack pointer out of the run-time stack, but not actually write to the entire area. A stack peak near stackSize but not exceeding it may indicate stack overflow.
ROV in CCS
To access the ROV while in a debug session in CCS:
Attention
You can enable live watch on ROV to automatically retrieve up to date information, however, the refreshing rate is not frequent. You can also pause the debugger or manually click refresh button to enforce a ROV information update.
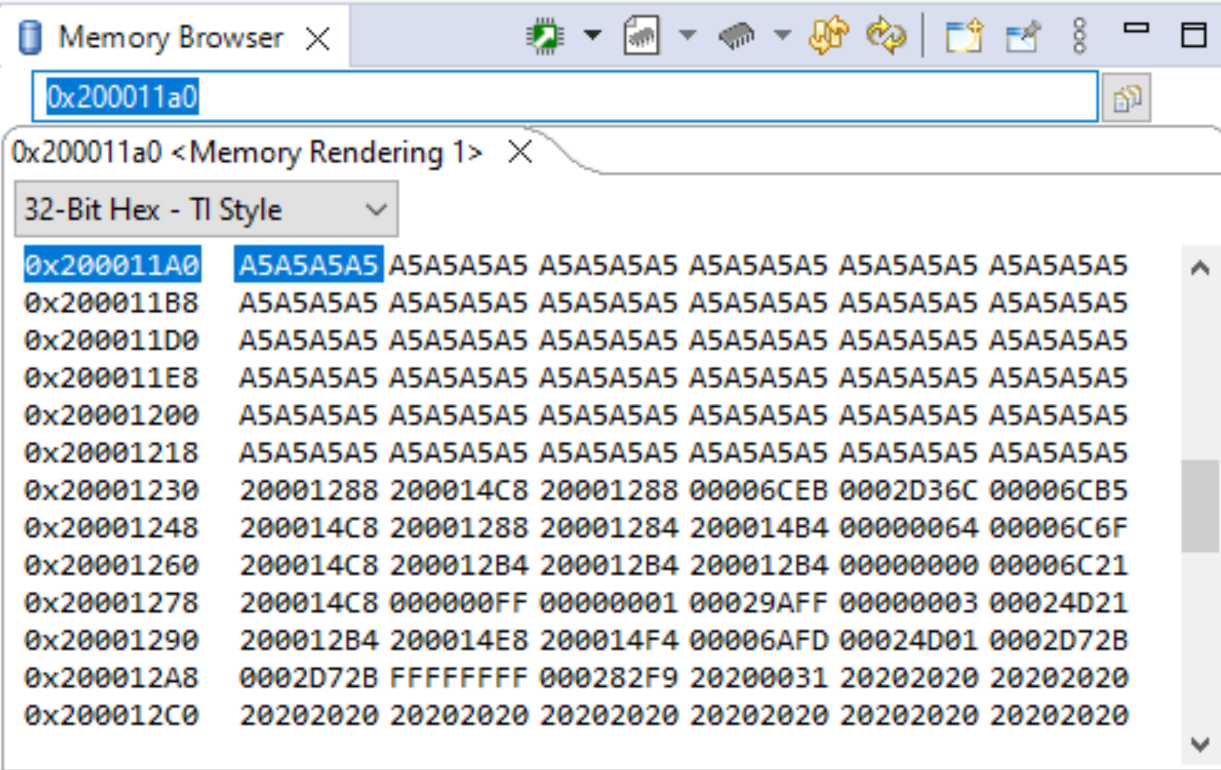
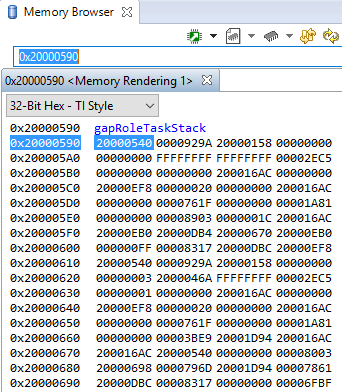
Using the Memory Browser
Debuggers are able to show a representation of the memory on the CC23xx. In
CCS, you can index by address or by symbol name. As an example, consider the stack
that was overrun in fig_rov_task_detailed:
Basic BLE Task’s stack. Note |
GAPRole Task’s stack has probably overflowed as it is completly filled. |
|
|
The solution in this case would be to increase the stack size for the failing
task and see what the stack peak really is. The stackPeak reported in Figure 85. is
relying on how many watermark bytes are overwritten, so it can’t know how much
the overrun amounts to.
Because stacks are utilized from higher addresses towards lower addressed (upwards in the picture), stacks that overrun will tend to overwrite data at locations immediately before the stack.
Connect the debugger to a running target
Connecting the debugger to a target can help when you want to see the status of your target after it has been running for several hours, or even days; or if you cannot reproduce a crash with the debugger attached. Once the debugger connected to the target, all the usual functionalities (break points, step-by-step, variable view, memory view…) are available.
This step-by-step guide will help you to configure CCS in order to connect to a running target
While the CC23xx is running the desired project, open CCS.
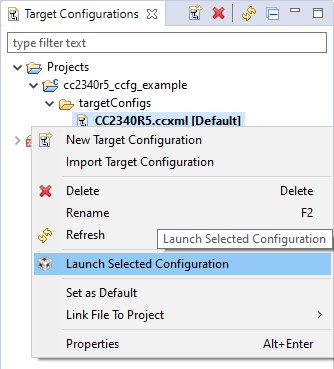
Open the Target Configurations window by click on View → Target Configurations.
In the Target Configurations window, expand the Projects folder.
Expand your project within the Projects folder inside the Target Configurations window.
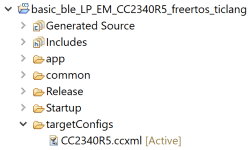
Expand the targetConfigs folder.
Right click on CC2340R5.ccxml and click on Launch Selected Configuration
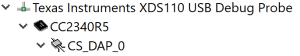
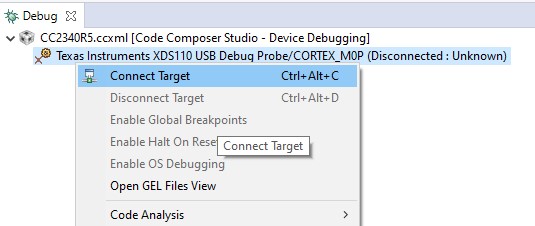
After a few seconds, CCS will connect to the target and the core will be visible in the Debug window.
Right click on the core and select Connect Target
Click on Run → Load → Load Symbols…
Click on Browse Project.
Select your project’s out file and press OK.
Press OK on Load Symbols window.
At this point you are connected to the target and should see where in the project the target is currently located.
Optimizations
Compiler optimizations are great for saving space or speeding up execution. However, these optimizations can be very difficult to debug around. There are multiple levels at which optimization can be turned on or off.
Project-wide optimization settings are the most general. Sometimes, given the constraints of the device, it is impossible to lower the size optimization level. File-wide optimization settings can be used like project-wide optimizations to turn on or off certain settings. The most granular control is using compiler directives to control optimization at a function level.
Optimizations in CCS
Project-Wide Optimizations
Open the project optimization settings by going to Project Properties
→ CCS Build → ARM Compiler → Optimization
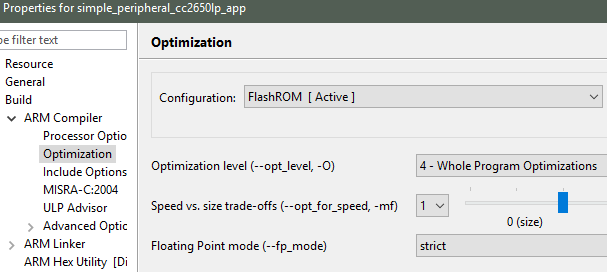
Figure 86. Project-level optimization setting in CCS
Single-File Optimizations
Note
Do single-file optimizations with care because this also overrides the project-wide preprocessor symbols.
Right-click on the file in the Workspace pane.
Choose Properties.
Change the optimization level of the file using the same menu in the CCS project-wide optimization menu.
Single-Function Optimizations
Warning
Care must be taken when using pragmas, since they are very specific to the toolchain and may render non-reusable code.
Important
- The TI ARM Clang compiler does not support single-function optimizations. Use Single File optimizations instead.
For additional details, check section 3 of the TI ARM Clang User’s Guide.
#pragma GCC push_options
#pragma GCC optimize ("O0")
static void myFunction(int number)
{
    // ...
    return yourFunction(other_number);
}
#pragma GCC pop_options
Deciphering Exceptions
Several possible exception causes exist. If an exception is caught, an
exception handler function can be called.
Arm Cortex User Guide
describes more about exception handler.
There are ways to determine whether the hang up is due to the hard
fault. One is to watch the Program Counter (PC) register which will indicate operation in the
hard fault handler. The second method is to watch the special-purpose program status registers (xPSR).
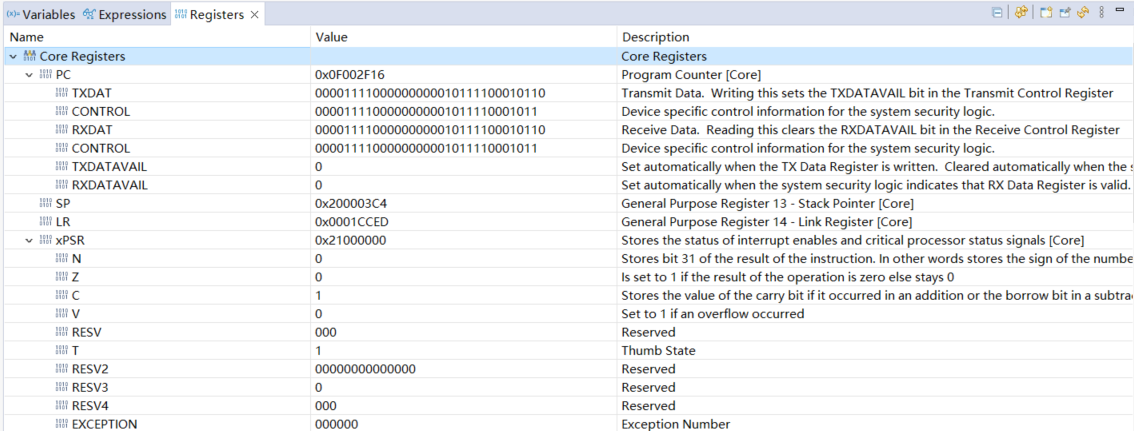
Figure 87. Exception Registers
Debugging Memory Problems
This section describes how to debug a situation where the program runs out of memory, either on the heap or on the runtime stack for the individual thread contexts. Exceeding array bounds or dynamically allocating too little memory for a structure corrupts the memory and can cause an exception like INVPC, INVSTATE, IBUSERR to appear in the CFSR register.
Task and System Stack Overflow
If an overflow on the runtime stack of the task or the system stack occurs (as found using the ROV plug-in), perform the following steps.
Note the current size of the runtime stack of each task.
Increase by a few 100 bytes
Reduce the runtime stack sizes so that they are larger than their respective stackPeaks to save some memory.
Check System Flash and RAM Usage With Map File
Both application and stack projects produce a map file which can be used to compute the combined flash and RAM system memory usage. Both projects have their own memory space and both map files must be analyzed to determine the total system memory usage. The map file is in the output folder of the respective project in IAR. To compute the total memory usage, do as follows.
Open the application map file (that is, application.map).
Note
At the end of the file, three lines contain a breakdown of memory usage for read-only code, read-only data, and read/write data.
Add the two values for read-only code and read-only data memory.
Note
This sum is the total flash memory usage for the application project. The read/write data memory is the total RAM usage by the application project.
Note these values.
Open the stack map file.
Compute the same flash and RAM values for the stack project.
Add the total flash memory value from the application with the total flash usage of the stack to determine the total system flash usage.
Add the total RAM usage from the application with the stack to get the total system RAM usage.
For CCS, the map file of the respective project gives a summary of flash and RAM usage. To determine the remaining available memory for each project, see Flash and RAM. Due to section placement and alignment requirements, some remaining memory may be unavailable. The map file memory usage is valid only if the project builds and links successfully.
Debugging Common Heap Issues
The BLE5-Stack uses FreeRTOS heap_4 module for its memory allocation and the memory usage can be viewed using Runtime Object Viewer.
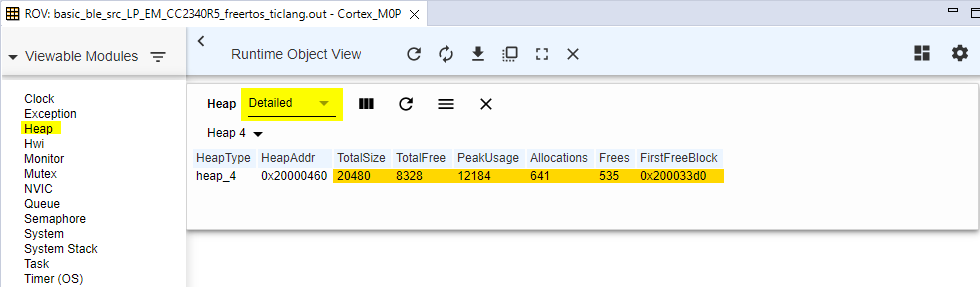
However, ROV does not provide you where in the software the heap statistics was updated. To have full control on where you want to see the heap usage, you can take advantage of vPortGetHeapStats. Here is an example showing the heap information under advertising and upon connection established using basic_ble example.
Include
#include <FreeRTOS.h>and declare global heapStats in app_peripheral.c1#include <FreeRTOS.h> 2 3// Struct to hold the heap statistics 4HeapStats_t heapStats;
Register for BLEAPPUTIL_ADV_END mask
1BLEAppUtil_EventHandler_t peripheralAdvHandler =
2{
3    .handlerType    = BLEAPPUTIL_GAP_ADV_TYPE,
4    .pEventHandler  = Peripheral_AdvEventHandler,
5    .eventMask      = BLEAPPUTIL_ADV_START_AFTER_ENABLE |
6                      BLEAPPUTIL_ADV_END_AFTER_DISABLE |
7                      BLEAPPUTIL_ADV_END
8};
Add the following code under
Peripheral_AdvEventHandlerto handle BLEAPPUTIL_ADV_END mask1void Peripheral_AdvEventHandler(uint32 event, BLEAppUtil_msgHdr_t *pMsgData) 2{ 3 BLEAppUtil_AdvEventData_t *advData = (BLEAppUtil_AdvEventData_t *)pMsgData; 4 5 switch(event) 6 { 7 case BLEAPPUTIL_ADV_END: 8 { 9 //get heap status here 10 vPortGetHeapStats(&heapStats); 11 break; 12 }
Add the following code under
Peripheral_GAPConnEventHandlerto get heap information when connection is established1void Peripheral_GAPConnEventHandler(uint32 event, BLEAppUtil_msgHdr_t *pMsgData) 2{ 3 case BLEAPPUTIL_LINK_ESTABLISHED_EVENT: 4 { 5 gapEstLinkReqEvent_t *gapEstMsg = (gapEstLinkReqEvent_t *)pMsgData; 6 vPortGetHeapStats( &heapStats );
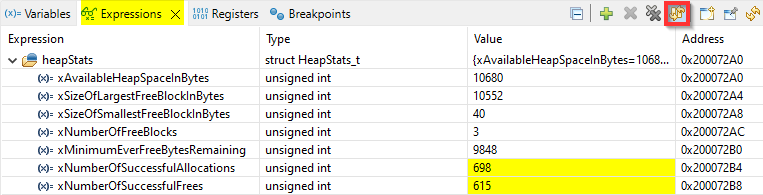
After programming the device, you can go to Expressions and enable live watch. You can then observe that the xNumberOfSuccessfulAllocations and xNumberOfSuccessfulFrees continue increasing when the advertising event is ongoing where the rest of the fields stay constant, this indicates that there is no memory leak during advertising.
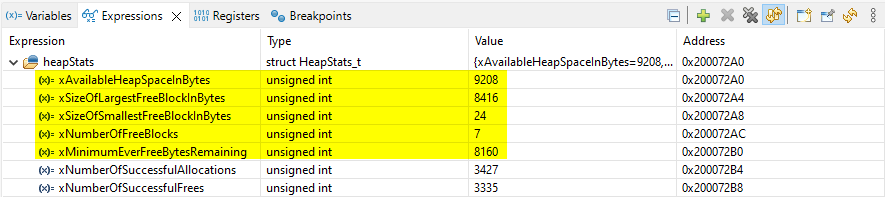
After connection established, you will see that the xAvailableHeapSpaceInBytes decrease which is due to BLE5-Stack allocates memory for connection related information.
Troubleshooting Heap Problems
Issues with dynamic allocated memory can be notoriously hard to track down and debug; this section aims to give tips on how to debug the most common issues with dynamic memory.
Writing to already freed memory
Pointers to memory which have already been freed using ICall_free() should
not be used. A common practice is to set pointers to NULL after they have
been freed, and check them for NULL before using them.
Writing a an already freed pointer will cause assert.
 1  // Allocate Memory
 2  uint32_t *myPtr = ICall_malloc(500);
 3
 4  //..
 5
 6  // Later free the pointer, set it to NULL
 7  ICall_free(myPtr);
 8  myPtr = NULL;
 9
10  // This check will protect against writing to already freed memory
11  if( NULL != myPtr)
12  {
13    *myPtr = 42;
14  }
Freeing Already freed Memory
The cause of this bug is the same as the one from the previous section, double frees will trigger assert in heap_4.
1  // Allocate Memory
2  uint32_t *myPtr = ICall_malloc(500);
3
4  //..
5
6  ICall_free(myPtr);
7  ICall_free(myPtr);
ICall Abort
ICall abort is a function call used to indicate a serious failure in the ICall or OSAL mechanism used by the stack.
The BLE Stack will call ICall_abort() when one of the below happens:
Calling a stack function through ICall in a stack callback or TI-RTOS/FreeRTOS SWI or HWI
Misconfiguring of additional ICall tasks or entities (usually when
OSAL_MAX_NUM_PROXY_TASKS + 1< than number of ICall tasks)Incorrect ICall task registering
Stack API call timed out while ICall is waiting for a response
ICall encountered an error while executing a stack API
ICall_primSetTimer()orICall_setTimer()are unable to create a clock object
By default ICall_abort() will raise a HAL assert if they are enabled.
You can set a breakpoint in the HAL assert handler and inspect the call stack
to understand the function that called the abort.
If HAL asserts are not enabled then the abort function will spin lock.
The user can set a breakpoint in ICall abort to see what is causing the abort.
See the HAL Assert Handling section for more information.
HAL Assert Handling
The HAL Assert module defines a mechanism for handling undesirable or unrecoverable state states in the code. The HAL Assert module is intended to be configurable and shared between the application and stack.
HAL Assert Design
The HAL_ASSERT() macro from hal_assert.h can be used to process a
failure state or condition. The way this macro is evaluated corresponds to how
the HAL assert module is configured. There are two types of HAL Assert:
Legacy HAL Assert
Extended HAL Assert
Legacy HAL assert will execute the halAssertHandler() from hal_assert.c.
The implementation of halAssertHandler() is controlled by preprocessor
defines that are explained in the next section.
Extended HAL assert will execute halAssertHandlerExt() from
hal_assert.c. This extended handler will execute any user provided callbacks
before executing the default halAssertHandler(). The user provided
callback will contain information including the cause and subcause of the error.
The subcause can be set with the HAL_ASSERT_SET_SUBCAUSE() macro before
executing HAL_ASSERT().
Attention
TI recommends that extended HAL asserts are always used whenever possible to ensure the most debugging features.
HAL Assert configuration
The behavior of the HAL Assert module is based on both the selection of
preprocessor defines and the call to halAssertInit().
EXT_HAL_ASSERT: Enables extended HAL asserts
HAL_ASSERT_RESET: Reset on assert usingHAL_SYSTEM_RESET()
HAL_ASSERT_SPIN: Spinlock on assert usinghalAssertSpinlock()
HAL_ASSERT_LIGHTSshould never be used.
To fully enable extended HAL Asserts halAssertInit() must be called with
HAL_ASSERT_LEGACY_MODE_DISABLED, otherwise the user supplied callback will
not be executed.
Recommended HAL Assert Configuration
TI recommends the following settings. Any other configuration is not recommended for new development.
EXT_HAL_ASSERTis defined in all BLE-Stack projects for of split-image and stack_library type
halAssertInit()should not be called by the application. Instead it is initialized by the stack inble_user_config.c(ble_user_config_stack.cfor examples that do not have a stack project).
The TI sample applications will plug a user callback for use
with the extended HAL assert in main.c using:
/* Register Application callback to trap asserts raised in the Stack */
RegisterAssertCback(AssertHandler);
The main.c file also contains an example AssertHandler() function.
The user is free to modify this function to meet the needs of their application,
but it should contain cases for all HAL assert types.
Hint
It is recommend to develop, debug, and vigorously stress test a product with asserts enabled. For production it is recommended that assert handling that results in a spinlock is removed.
Adding HAL Assert Support To the Application
Single Project
Define EXT_HAL_ASSERT in the app project predefined symbols list.
halAssertInit() is initilized by the stack in ble_user_config_stack.c
for examples that do not have a stack project.
Stack Library
In the stack library configuration, the stack and application images are
combined, and no action is needed to use HAL asserts in the application layer
or to plug the user call back using RegisterAssertCback(). (For stack
library configuration, there is no need to define EXT_HAL_ASSERT in the
app project.)
Split Image
The HAL assert code must live on both the stack and the application side in
order for the user to supply a callback via RegisterAssertCback() or to use
HAL asserts in the application. This includes
Adding
hal_assert.cto the application projectDefining
EXT_HAL_ASSERTin the application project as a preprocessor symbol
HAL Assert Causes and Explanation
As mentioned above, the BLE-Stack will use HAL_ASSERT() to trap in the case
a failure state is encountered. By default, asserts will be sent to the
AssertHandler() function that is provided in main.c of the TI sample
applications. The table below describes the various HAL assert types that are
used in the stack and what they mean. This table assumes EXT_HAL_ASSERT
is defined as recommended above.
HAL Assert Cause |
Reason |
HAL_ASSERT_CAUSE_OUT_OF_MEMORY |
Malloc failed when |
HAL_ASSERT_CAUSE_OUT_OF_MEMORY |
Critical callbacks cannot be allocated by the GAP central or peripheral link managers or SM |
HAL_ASSERT_CAUSE_RF_DRIVER_ERROR |
RF error callback is executed by RF driver. |
HAL_ASSERT_CAUSE_ICALL_ABORT |
ICall has encountered a critical error and needs to abort using |
HAL_ASSERT_CAUSE_ICALL_TIMEOUT |
A stack API that was executed via ICall took longer than ICALL_TIMEOUT_PREDEFINE to return. This usually means that the stack has hung. |
HAL_ASSERT_CAUSE_INTERNAL_ERROR |
When a split image application executes an API call that is not available in the stack image. |
HAL_ASSERT_CAUSE_UNEXPECTED_ERROR |
Used by NPI UART and SPI transport layers to indicate the the driver is already in use |
HCI Hardware Errors
HCI Hardware errors are another mechanism by which the BLE-Stack may indicate that it has encountered an unrecoverable or unexpected state.
The stack will use ICall/OSAL to send a message to the app’s message queue with more information about the failure.
HCI hardware errors can be masked by the application using the
HCI_SetEventMaskCmd(), but this is not the default behavior.
Registering for HCI Hardware Errors
By default the TI provided sample applications will register for HCI events, and
process them using the _processStackMsg function within the application.
HCI hardware errors will be sent to the application as HCI_GAP_EVENT_EVENT
with an event code of HCI_BLE_HARDWARE_ERROR_EVENT_CODE. For more on
processing HCI events in the application, please see Host Controller Interface (HCI).
By default the sample applications will assert when a HCI Hardware error
is received, using the same assert handler as the extended HAL asserts
(AssertHandler()).
Decoding Hardware Error Reason
In the application’s _processStackMsg(ICall_Hdr *pMsg) function, there
is a case for HCI_GAP_EVENT_EVENT which has a subcase where
HCI_BLE_HARDWARE_ERROR_EVENT_CODE is processed.
The case for the hardware error processing can be enhanced to expose the error code like so:
case HCI_BLE_HARDWARE_ERROR_EVENT_CODE:
{
    hciEvt_HardwareError_t *hardCode =(hciEvt_HardwareError_t*)pMsg;
    AssertHandler(HAL_ASSERT_CAUSE_HARDWARE_ERROR, hardCode->hardwareCode);
}
A breakpoint can be set in this function to determine the error code. This
code should be reported to a TI engineer when experiencing a HCI hardware
assert. These error codes are defined in ll_common.h and hci.h.
Debugging RF Output
As mentioned in the CC23xx SimpleLink Wireless MCU Technical Reference Manual, the RF output can be mapped to pins on the LaunchPad for RF signal debugging. These pins are intended to be used when connecting an RF range extender. However, they can also help in instances where it is unclear if the device is transmitting or receiving in the right window.
To enable RF output debugging, you will need to map the RF Core LNA enable and PA enable output or Tx start signals to a GPIO. The code snippet below shows how to use DIO11 (radio TX) and DIO21 (radio RX). By connecting a logic analyzer to these pins, the RF activity over time can be recorded.
Initialize IOs
/*******************************************************************************
 * INCLUDES
*/
#include DeviceFamily_constructPath(driverlib/dbell_regs.h)
#include DeviceFamily_constructPath(inc/hw_types.h)
#include DeviceFamily_constructPath(inc/hw_ioc.h)
#include DeviceFamily_constructPath(inc/hw_memmap.h)

// ...

int main()
{

    /*
     * Add the following after Board_initGeneral();
     * Be sure IOIDs used below are not used by any entries in PIN or
     * GPIO tables from the board files
     */

    /* IO for TX Indication */
    HWREG(IOC_BASE + IOC_O_IOC11) |= IOC_IOC11_PORTCFG_PFUNC4;

    /* IO for RX Indication */
    HWREG(IOC_BASE + IOC_O_IOC21) |= IOC_IOC21_PORTCFG_PFUNC5;

    // ...

}
Declare
RCL_Tracer_enablefunction in your application file with the following content. There is no retention on S_DBELL_GPOSEL0, therefore, the setting will disappear after entering the standby. To avoid losing the configuration, we can useRCL_Tracer_enableto circumvent. This function will automatically be called by the Radio Control Layer (RCL) each time the radio is restarting. By default it is defined as weak function in the RCL and can be overriden by application code./======== RCL_Tracer_enable ======== / void RCL_Tracer_enable(void) { / TX, RX Indication */ S_DBELL_GPOSEL0 |= DBELL_GPOSEL0_SRC0_RFEGPO0 << DBELL_GPOSEL0_SRC0; S_DBELL_GPOSEL0 |= DBELL_GPOSEL0_SRC1_RFEGPO1 << DBELL_GPOSEL0_SRC1; }
Warning
The pins used for the RF observables cannot be changed.
Packet Sniffer
In order to determine what is going on over the air, it’s recommended to have a packet sniffer that can track BLE advertisement packets as well as an established BLE connection.
Note
SmartRF Protocol Packet Sniffer and SmartRF Packet Sniffer 2 can be used for Bluetooth LE debugging when working with any Bluetooth LE compatible devices, including the CC23xx devices. However, the CC23xx devices cannot be used as sampling device for the Packet Sniffer tools. Refer to the “Required Hardware” section for more details.
Install the Required Software
Download and install the following software:
Important
It is important that you use the appropriate version of Wireshark. Please find the version you need in the SmartRF Packet Sniffer 2 User’s Guide, under ‘Getting Started > Installation’.
SmartRF Packet Sniffer 2, which contains sniffer firmware for the CC13xx and CC26xx family
Uniflash, used to program devices from the CC13xx and CC26xx family
Flash Programmer 2, used to program devices from the CC13xx and CC26xx family
Required Hardware
Any device from the CC13xx and CC26xx family which supports BLE commands can be used as a sniffer. Following is a list of all supported development boards:
Uniflash Setup
Connect the LaunchPad via USB
Start Uniflash
Connected device should be under ‘Detected Devices’. Click Start.
If it is not, choose your device type from ‘New Configuration’. Click Start.
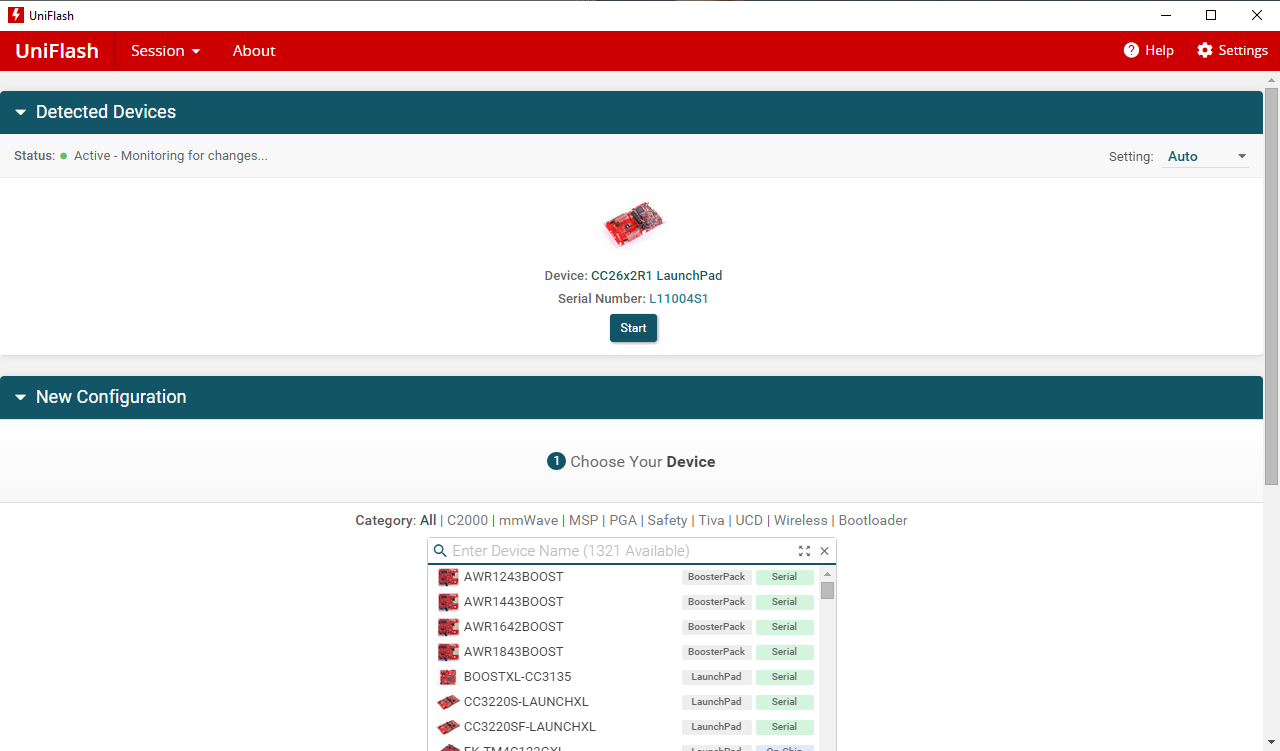
Figure 88. Connected Devices Displayed on Uniflash.
Browse for the Flash image corresponding to your device under
<SmartRF Tools installpath>\SmartRF Packet Sniffer 2\sniffer_fw\bin. Click Load Image.
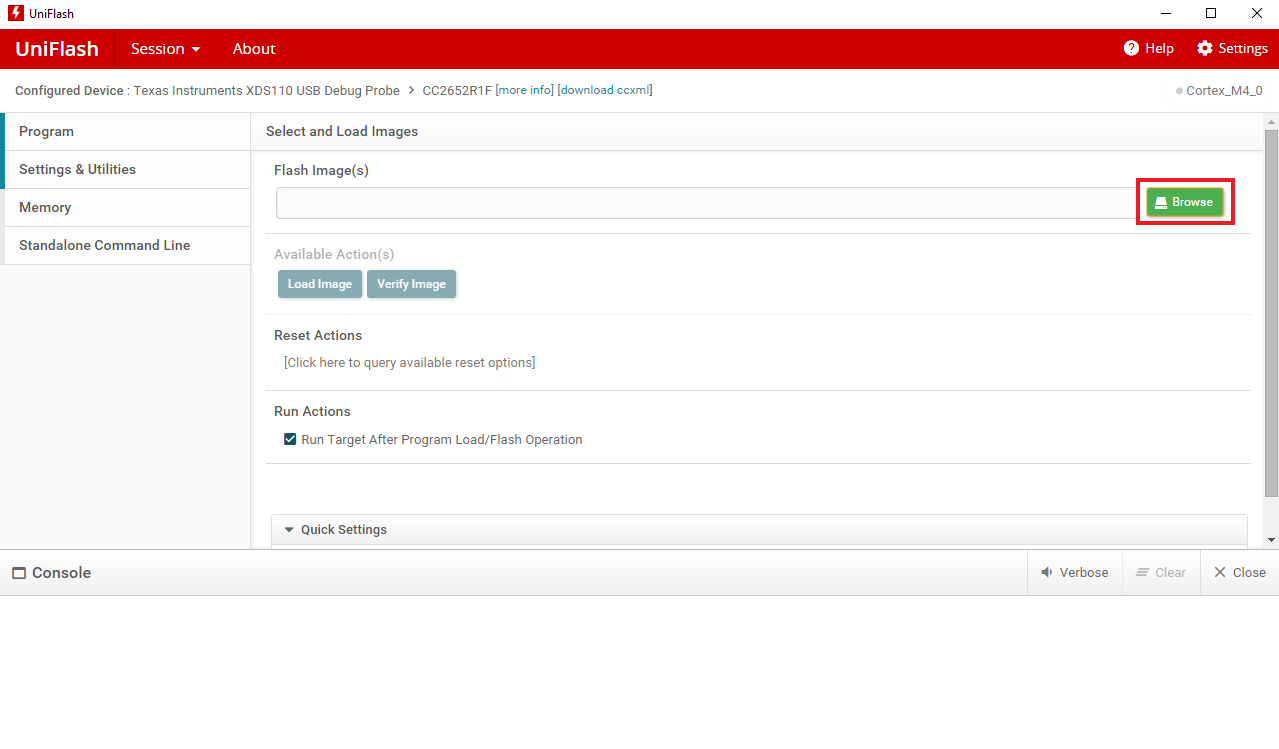
Figure 89. Browse for and Load Image on Uniflash.
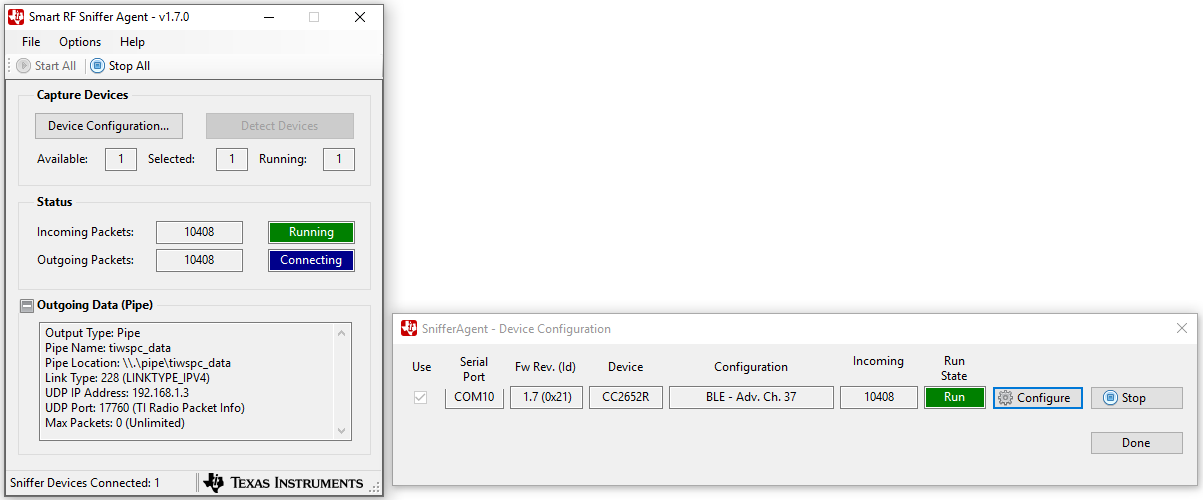
SmartRF Sniffer Agent Setup
Start SmartRF Sniffer Agent.
Select Options->Data->Data Out. Check Use Pipe and click ‘OK’.
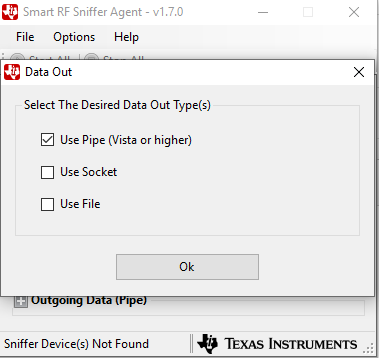
Figure 90. Select Use Pipe for Data Out
Click Detect Devices to find the sniffer device.
-If it does not show up, disconnect and reconnect the device and try again.
Once your device is discovered click the checkbox under ‘Use’ and then click ‘Configure’.
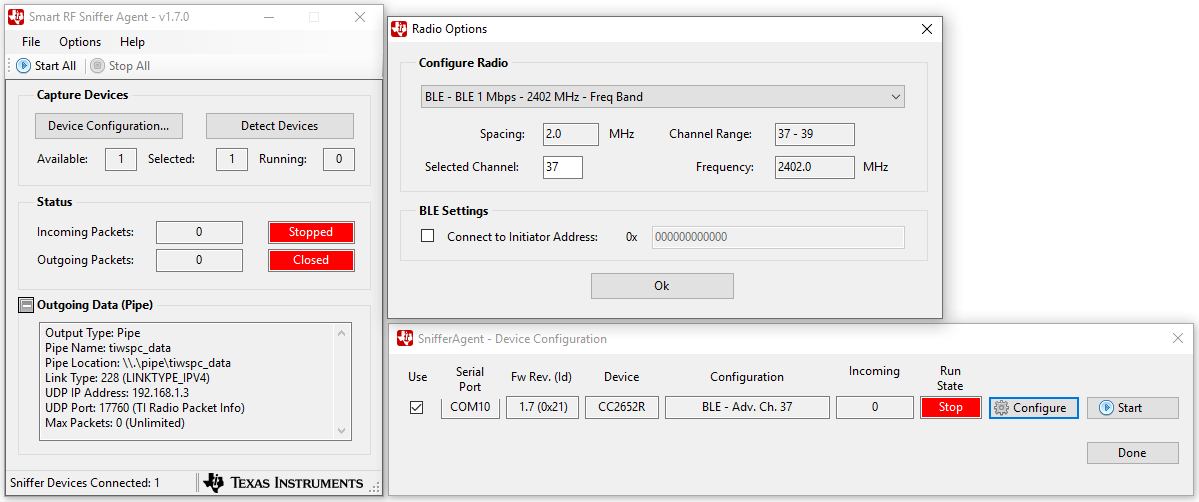
Figure 91. Configure the Sniffer Device
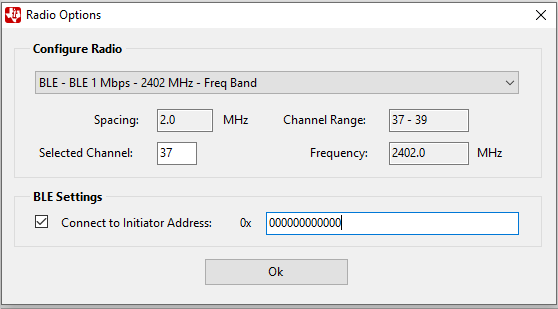
Use the settings shown for BLE configuration.
-For BLE, use advertising channel 37, 38, or 39. -The sniffer can be configured to follow a connection between a specific BLE Central (initiator) and Peripheral device. Click the checkbox next to ‘Connect to Initiator Address’ and write the address of the Central (Initiator) device. The address of the device is printed to the display in most of our examples, but can also be found using an external tool such as the SimpleLink Starter mobile app. If this option is not selected, the device will follow the first connection that appears on the channel that was selected.
Settings for BLE configuration.
Click ‘OK’, then press ‘Start All’. -The ‘Incoming Packets’ indicator should turn green, and the ‘Outgoing Packets’ indicator should turn blue. Shown below.~
Wireshark Setup
Create a new Wireshark desktop shortcut. Modify the Target setting by adding
-i\\.\pipe\tiwspc_data -kto the end of the current target entry.
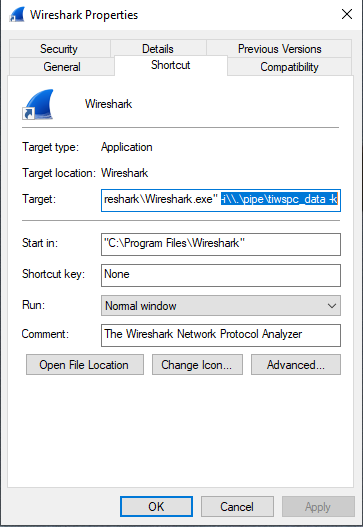
Figure 92. Modifying the target entry.
Run Wireshark from the new shortcut.
The packets should now be displayed.
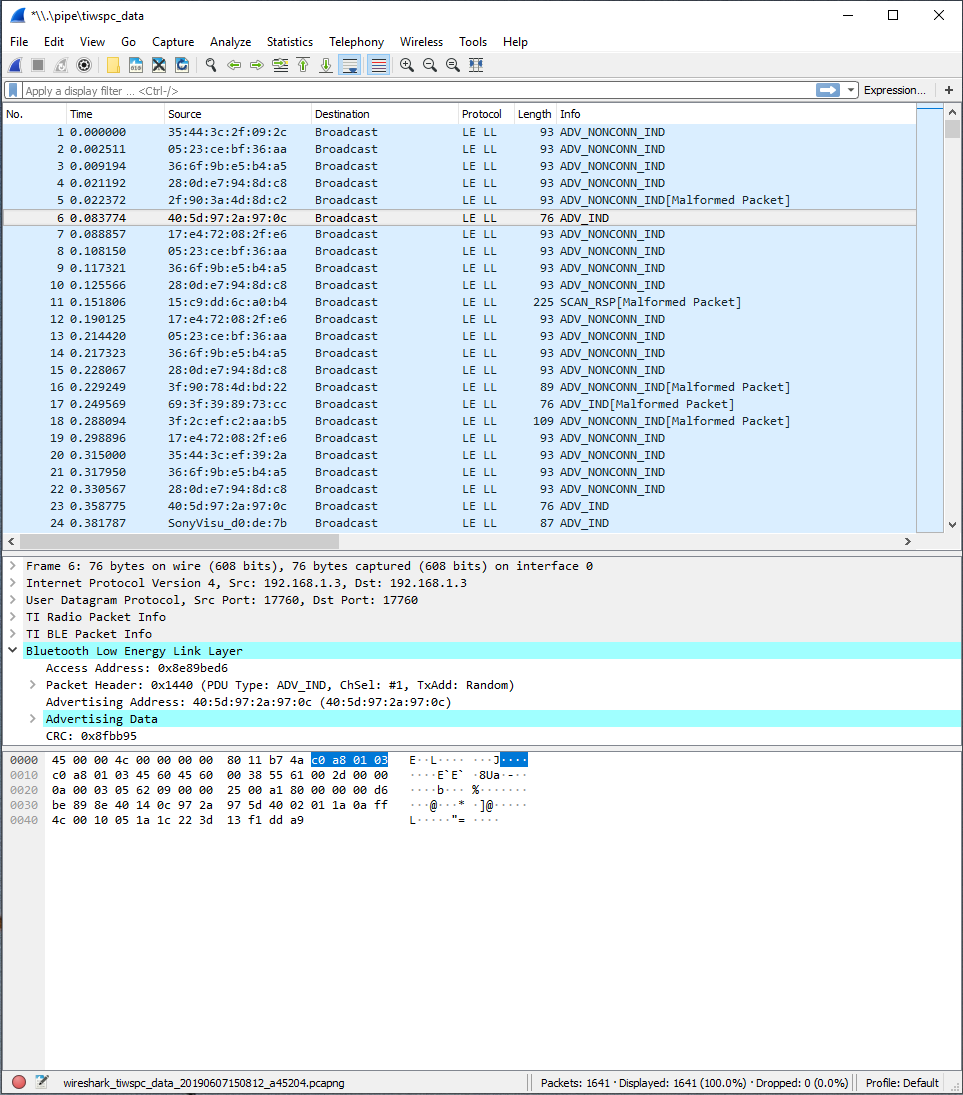
Figure 93. Example BLE packets displayed using Wireshark.
Debugging guide for serial interfaces
The aim of this chapter is to give some pointers on what to check if some issues are seen when using the UART, SPI, or I2C interfaces.
Note: TI only supports how to use the serial interface modules and the TI supplied drivers for these interfaces. TI are not able to help on the usage of a non-TI device connected to I2C, SPI or UART.
I2C
The I2C interface needs an external pull-up resistor. On the LauchPad these are 3.3 kOhm.
Measure the waveform on the I2C interface with an oscilloscope to verify the SCL and SDA levels
Monitor the interface with a logic analyzer. Check that data on the bus is the same as the wanted data.
Check the interface by reading out the device ID of the sensor.
Check the slave address. The I2C module uses a 7-bit address. The last 8th bit is the data direction bit. This last bit is appended automatically by the driver/HW. The Slave address given to the driver has therefore to be 7-bit.
Ensure that the readCount and writeCount is according to the register size used. If the result register in the sensor is 16-bit, the readCount has to be set to 2.
SPI
Monitor the interface with a logic analyzer. Compare the waveform with the waveform given in the datasheet for the device you are communicating with.
Check that the CSn is set correctly.
Check that the frame format is set correctly. Check if the device you are communicating with uses SPO = 1 or 0 and SPH = 1 or 0.
UART
Make sure to connect the TX pin of one device to the RX pin of the other device, and vice versa. If flow control is enabled, then the same applies towards the CTS and RTS pins.
Verify all communication settings between devices, including baud rate, data length, stop/parity bits and flow control.
Evaluate the interface with a logic analyzer or oscilloscope, using an analyzer tool if possible to convert the waveforms into their numerical counterpart.