7.1. CC3200 Thermometer Dashboard: IoT wifi based communication (v2 Component Library)
Visualize your LaunchPad temperature data on a GUI Composer Dashboard
In this tutorial, we will show you how to send your CC3200 SimpleLink™ Wi-Fi® LaunchPad temperature sensor data to the cloud and build a thermometer dashboard on the cloud using GUI Composer.
7.1.1. Preparation
Here’s what you need to run this tutorial:
A CC3200 SimpleLink™ Wi-Fi® LaunchPad. To enable the sensors, the jumpers J2 and J3 should be placed for I²C SDA and SCL respectively as shown below:
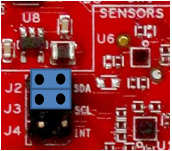
Fig. 7.1 jumper
A WPA2-Personal Wi-Fi connection to the internet (This type of connection only requires the SSID and password to login to the network.)
The latest version of the Chrome web browser
A myTI account for accessing CCS CLoud and GUI Composer
7.1.2. Get Your CC3200 Launchpad Connected
Program your LaunchPad to send its temperature sensor data to the Internet of Things Foundation QuickStart Service (IOTF Quickstart).
Plug your LaunchPad into the computer with the included USB cable.
ccs_code
Import the project to the CCS CLoud by clicking
 above. A new window will launch and you may need
to provide your myTI login credentials.
above. A new window will launch and you may need
to provide your myTI login credentials.In CCS Cloud, make sure the mySSID.h file is open. It can be found in the Workspace Files under GC_IOT_CC3200_GetStarted → mySSID.h double-click to open the file and between the
" "marks enter your SSID/Network Name on line 2 and the Network password on line 4.
Then, press File → Save All to confirm the changes.
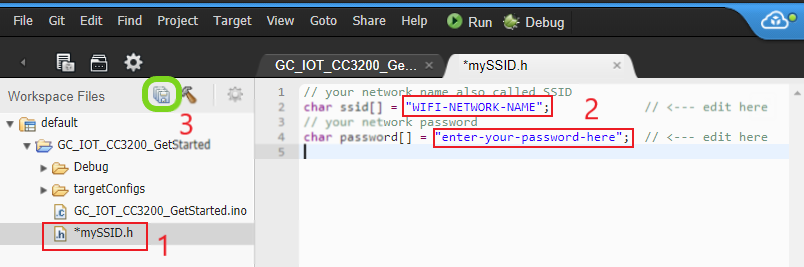
Fig. 7.2 SSID And Password Edit
Flash the project to your LaunchPad by pressing the run button
 . You may need to install TI Cloud
Agent,
which adds a browser extension and local driver files that let Chrome
communicate with the LaunchPad.
. You may need to install TI Cloud
Agent,
which adds a browser extension and local driver files that let Chrome
communicate with the LaunchPad.
Now check to see if your LaunchPad is sending anything to the serial port. In CCS Cloud,at the top right menu, click Target → Connect COM Port. Select the COM port and set the baud rate to 11520 and click Connect. You should look for a 12-digit hexadecimal device ID in the Serial Monitor.
7.1.3. Build your own dashboard
You can build your own dashboard reflecting the values found on your Launchpad on the cloud using GUI Composer.
Go to GUI Composer. Yuo may need to login using your myTI credentials.
At the GUI Composer landing page, click CREATE A NEW PROJECT to open the New Project Wizard.
At the New Project Wizard, set your project template as
Dashboard. Click onAutofilland click Next.
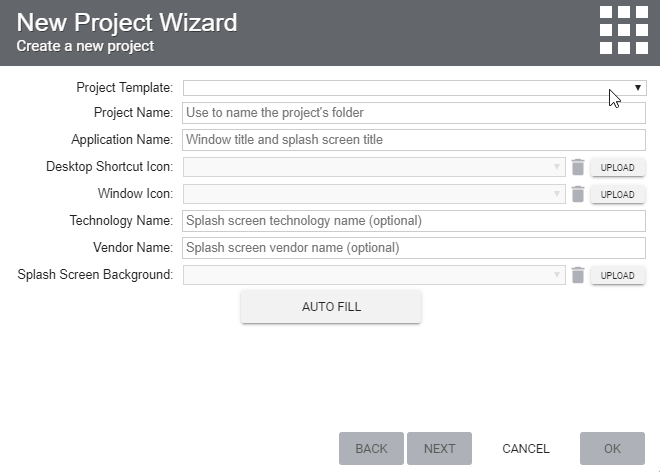
Fig. 7.3 newprojfirstpage
Skip the Target Programming page by clicking Next. On the next Target Communication Setting page, click on
 and select
Network. From the Available Models dropdown, select IBM IoT and
press Add. The model id will be
and select
Network. From the Available Models dropdown, select IBM IoT and
press Add. The model id will be ti_model_iot_ibmby default.
On the new IBM IoT Model table, Press on to add a device.
Enter the device ID of your LaunchPad
Under Binding name, give it a nickname of
device
Click  to test the connection.
Click the Connect button and switch to the Console tab in the Target Communication page
You can click Console tab to verify there are no errors.
When the connection is established, the connect button will be changed to
 .
.When device data is received, the device status icon
 will change to
  .
.
Click OK to save the configuration and close New Project Wizard dialog.
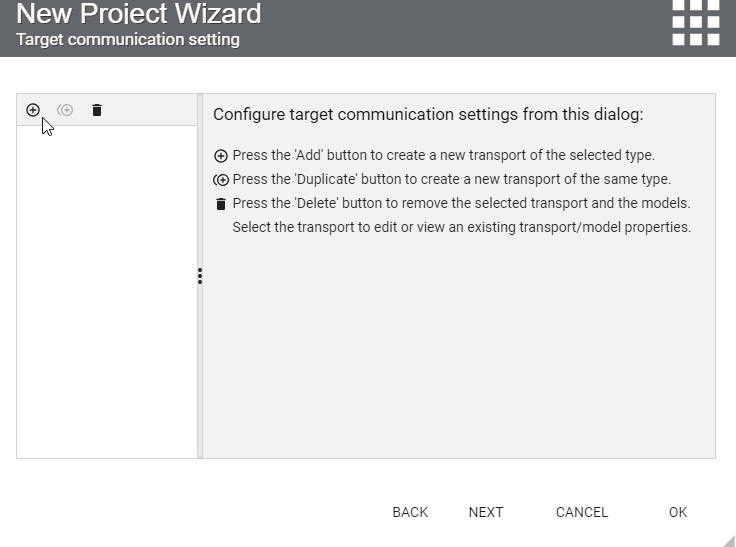
Fig. 7.4 CreateIoTModel
Click the
 button on the left column to open the
Component Palette.
button on the left column to open the
Component Palette.
Under Dials & Gauges, select Thermometer
Drag and drop the text onto the grid to create a thermometer tile
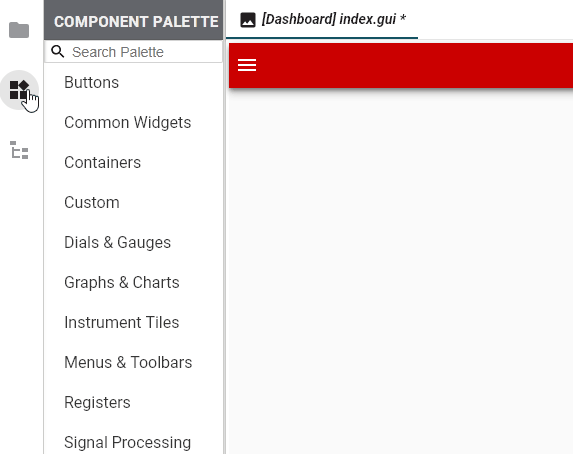
Fig. 7.5 NewTileProperty
After the thermometer tile is created, you will find a thermometer tile in the middle and the tile property editor
 on
the left column.
on
the left column.
In the QuickStartWiFi project, the LaunchPad is programmed to send a status event every second. The status event is an object with two members:
deviceIDandtemperature.
Open the thermometer property editor, you can bind variable to a property of the tile widget as follows:
Select a property and click
 to initiate the binding.
There will be a dropdown list on the left and a text box on the right.
The dropdown list consists a list of bindable components defined in your project.
By default,
ti_model_httpis selected; this refers to the IOT data model you created.
In the text box, enter the binding endpoint.
The format for an endpoint is
[device nickname].[event name].[data member]The device nicknames are defined in the devices table.
The event names and data members are automatically inferred from the data received from the device.
Your input are automatically matched to these lists as you type.
You can use
ctrlkey or by entering a period to bring up the matches, with using your arrow keys or mouse to navigate those matches. Press the enter key or a click to confirm your selection.
The animation below illustrates the steps to bind both members.
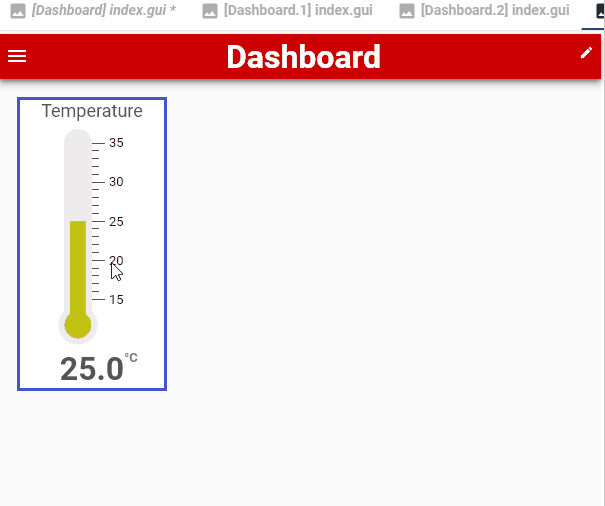
Fig. 7.6 EditTileProperties
Click the preview button
 to preview your dashboard. A new
browser window or tab will be opened to display the dashboard.
to preview your dashboard. A new
browser window or tab will be opened to display the dashboard.
Why is the dashboard not popping up?
The web browser security setting may disallow pop-up from a website. You need to add our GUI Composer Cloud website to the list of exceptions to allow the dashboard to pop up.
You have previewed your dashboard application! You should bookmark the URL of your preview window so you can open the dashboard on another PC or mobile devices by visiting this URL; you may need to provide your myTi login credentials.
You may also download your application to desktop and combine it with GUI Composer Runtime to run your application as a desktop app. See the Deploy section in the User Guide for more information.
Congratulations! You have completed your tutorial.